Steve Strazza Under The Hood From the Desk of Steve Strazza @Sstrazza. Welcome back to Under the Hood, where we'll cover all... March 16, 2026 All Star Charts Premium Members Only Search Displaying 9697 - 9720 of 21152 Sean McLaughlin [Options P2P] New Position: XLP The next new position in our Paid-to-Play portfolio is: May 12, 2023 Options Paid to Play Paid To Play Members Only JC Parets Co-Founder Ehrsam Reports a $50 Million COIN Buy The largest insider transaction on today’s Hot List is a Form 4 filing by the co-founder of Coinbase $COIN, Fred Ehrsam. Ehrsam revealed the purchase of 810,000 shares of COIN, equivalent to $50 million. May 12, 2023 Stocks Strazza The Hot List JC Parets Swing Trader Pro: Morning Briefing (05-12-2023) From the Desk of Kimmy Sokoloff This sideways action in the market is tiring. We do find setups, but I haven't been enthused with most of them. May 12, 2023 Stocks Swing Trader Pro Newsletter JC Parets [Premium] Details For May 2023 Mid-Month Conference Call These are the registration details for our Live Mid-month Conference Call for Premium Members of All Star Charts. Our Live Call will be held on Tuesday May 16th at 6PM ET. As always, if you cannot make the call live, the... May 12, 2023 All Star Charts Premium ASC Members Only Patrick Dunuwila Daily Chart Report 📈 Thursday, May 11, 2023 May 11, 2023 The Chart Report Uncategorized Daily Chart Report Front Top Content Featured Stories JC Parets Swing Trader Pro: Afternoon Briefing (05-11-2023) From the Desk of Kimmy Sokoloff It was Chop City for the market today. It will likely pick a direction soon. May 11, 2023 Stocks Swing Trader Pro Newsletter Ian Culley From Potential Cut to Possible Hike: Markets React as Probabilities Flip Bonds are catching a bid as a risk-off tone plays across the market. Aside from intraday knee-jerks in price, not much has changed. Rates and the... May 11, 2023 All Star Charts Premium Premium bonds ASC Bond Report Members Only Patrick Dunuwila Chart of the Day - Thursday, May 11, 2023 May 11, 2023 The Chart Report Gold Copper TCR Chart of the Day Copper/Gold Ratio $GC_F $HG_F Patrick Dunuwila Chart of the Day - Friday, May 12, 2023 May 11, 2023 The Chart Report TCR Chart of the Day $DXY Shane Murphy Sean McLaughlin [Options P2P] New Position: DIA The next new position in our Paid-to-Play portfolio is: May 11, 2023 Options Paid to Play Paid To Play Members Only JC Parets Risk Reversal In Small-caps Small-cap stocks are back down to where they bottomed out last summer. Can they do it again? I believe they can, and that's the... May 11, 2023 Stocks ASC ASC Chart of the Day JC Parets Hestia Capital Raises Its PBI Stake to 9% The largest insider transaction on today’s Hot List is a Form 4 filing by Pulse Biosciences $PLSE director Robert W. Duggan. Duggan reported a purchase worth roughly $65 million in PLSE. May 11, 2023 Stocks Strazza The Hot List JC Parets Swing Trader Pro: Morning Briefing (05-11-2023) From the Desk of Kimmy Sokoloff It's just like Tuesday... With PPI coming up at 8:30 a.m. ET, I'm going to hold off on sharing ideas until I see how the market reacts. May 11, 2023 Stocks Swing Trader Pro Newsletter Alfonso De Pablos, CMT 2 to 100 Club (05-10-2023) From the Desk of Steve Strazza @Sstrazza Welcome to the 2 to 100 Club. As many of you know, something we've been working on internally is using various bottom-up tools and... May 10, 2023 All Star Charts Premium 2 to 100 Club Premium Stocks ASC Strazza 2-to-100 Club Members Only Patrick Dunuwila Daily Chart Report 📈 Wednesday, May 10, 2023 May 10, 2023 The Chart Report Uncategorized Daily Chart Report Front Top Content Featured Stories JC Parets Swing Trader Pro: Afternoon Briefing (05-10-2023) From the Desk of Kimmy Sokoloff What a day... $SPY came close to the 415 level I mentioned this morning and then traded below 410. ... May 10, 2023 Stocks Swing Trader Pro Newsletter Patrick Dunuwila Chart of the Day - Wednesday, May 10, 2023 May 10, 2023 The Chart Report Uncategorized Momentum $SPX Todd Sohn TCR Chart of the Day Sean McLaughlin [Options] It's Now or Never, Smalls [9/7: updated stop to 180. We're already #FreeRiding, so whatever we sell for is pure profit!] It's time for the small caps to make a stand. The time is now. If they don't, it could be 'goodnight' for a long time. ... May 10, 2023 All Options Options Premium ASC Sean McLaughlin [Options P2P] New Position: XLV The next new position in our Paid-to-Play portfolio is: May 10, 2023 Options Paid to Play Paid To Play Members Only Sean McLaughlin [Options P2P] Trade Alert: Exited XLP For a Profit We had a resting GTC order filled at our profit target in the Paid-to-Play portfolio today: May 10, 2023 Options Paid to Play Paid To Play Members Only JC Parets Insiders Scoop Up EVA, USB, and SOFI Shares The largest insider transaction on today’s Hot List is a Form 4 filing by Enviva Inc $EVA director John Bumgarner Jr. Bumgarner reported a purchase worth roughly $1.8 million in EVA. May 10, 2023 Stocks Strazza The Hot List JC Parets Swing Trader Pro: Morning Briefing (05-10-2023) From the Desk of Kimmy Sokoloff CPI data for April will be released at 8:30 a.m. ET. I'll hold off on ideas until I see how the market reacts. May 10, 2023 Stocks Swing Trader Pro Newsletter JC Parets Inside Scoop Weekly Strategy Session - May 10, 2023 This is the video recording of the May 10, 2023, Inside Scoop Weekly Strategy Session. May 10, 2023 Hot Corner Insider Stocks Strazza Inside Scoop Inside Scoop Strategy Session Inside Scoop Strategy Session Members Only Patrick Dunuwila Daily Chart Report 📈 Tuesday, May 9, 2023 May 9, 2023 The Chart Report Uncategorized Daily Chart Report Front Top Content Featured Stories Pagination Back 1 … Page 401 Page 402 Page 403 Page 404 Page 405 Page 406 Page 407 Page 408 Page 409 … 882 Next Recent Episodes The Morning Show The Morning Show - March 16, 2026 March 16, 2026 Hosted by Spencer Israel JC Parets Steve Strazza With special guest(s) Kenny Glick Michael Batnick Jason Perz Thompson's Two Cents Thompson's Two Cents Live! March 13, 2026 Hosted by Larry Thompson The Morning Show The Morning Show - March 13, 2026 March 13, 2026 Hosted by Spencer Israel JC Parets Steve Strazza With special guest(s) Kenny Glick Sam Ro Louis Sykes Special Report Fast Money Charts March 12, 2026 With special guest(s) JC Parets Steve Strazza Options Jam Session Options Strategy Deep Dive: What Traders Need to Know March 12, 2026 Hosted by Sean McLaughlin ASC Gold Rush Live The Death Of Energy (Again) March 12, 2026 Hosted by Jason Perz Sam Gatlin Missed it? No problem!Replays of all our past episodes are always available in the episode archives. View Episode Archives
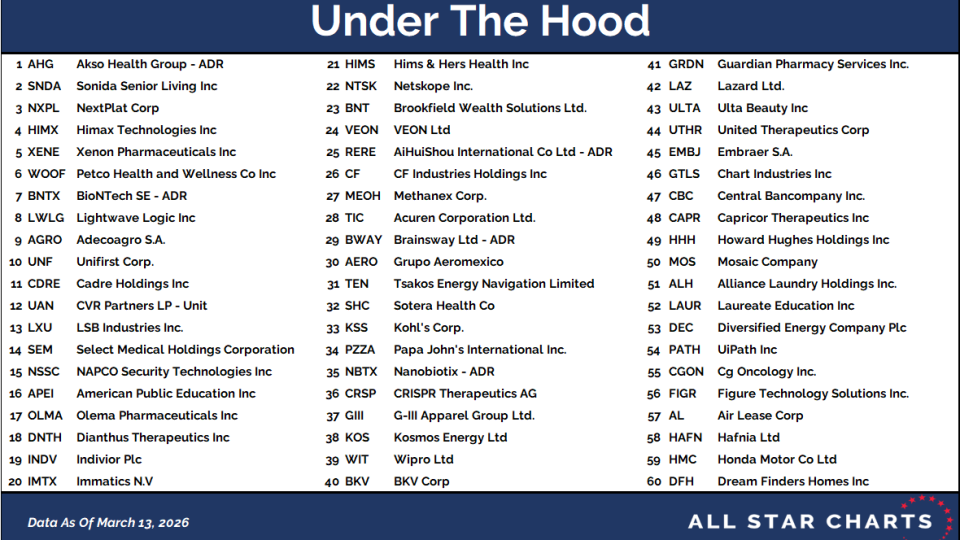
Steve Strazza Under The Hood From the Desk of Steve Strazza @Sstrazza. Welcome back to Under the Hood, where we'll cover all... March 16, 2026 All Star Charts Premium Members Only
Sean McLaughlin [Options P2P] New Position: XLP The next new position in our Paid-to-Play portfolio is: May 12, 2023 Options Paid to Play Paid To Play Members Only
JC Parets Co-Founder Ehrsam Reports a $50 Million COIN Buy The largest insider transaction on today’s Hot List is a Form 4 filing by the co-founder of Coinbase $COIN, Fred Ehrsam. Ehrsam revealed the purchase of 810,000 shares of COIN, equivalent to $50 million. May 12, 2023 Stocks Strazza The Hot List
JC Parets Swing Trader Pro: Morning Briefing (05-12-2023) From the Desk of Kimmy Sokoloff This sideways action in the market is tiring. We do find setups, but I haven't been enthused with most of them. May 12, 2023 Stocks Swing Trader Pro Newsletter
JC Parets [Premium] Details For May 2023 Mid-Month Conference Call These are the registration details for our Live Mid-month Conference Call for Premium Members of All Star Charts. Our Live Call will be held on Tuesday May 16th at 6PM ET. As always, if you cannot make the call live, the... May 12, 2023 All Star Charts Premium ASC Members Only
Patrick Dunuwila Daily Chart Report 📈 Thursday, May 11, 2023 May 11, 2023 The Chart Report Uncategorized Daily Chart Report Front Top Content Featured Stories
JC Parets Swing Trader Pro: Afternoon Briefing (05-11-2023) From the Desk of Kimmy Sokoloff It was Chop City for the market today. It will likely pick a direction soon. May 11, 2023 Stocks Swing Trader Pro Newsletter
Ian Culley From Potential Cut to Possible Hike: Markets React as Probabilities Flip Bonds are catching a bid as a risk-off tone plays across the market. Aside from intraday knee-jerks in price, not much has changed. Rates and the... May 11, 2023 All Star Charts Premium Premium bonds ASC Bond Report Members Only
Patrick Dunuwila Chart of the Day - Thursday, May 11, 2023 May 11, 2023 The Chart Report Gold Copper TCR Chart of the Day Copper/Gold Ratio $GC_F $HG_F
Patrick Dunuwila Chart of the Day - Friday, May 12, 2023 May 11, 2023 The Chart Report TCR Chart of the Day $DXY Shane Murphy
Sean McLaughlin [Options P2P] New Position: DIA The next new position in our Paid-to-Play portfolio is: May 11, 2023 Options Paid to Play Paid To Play Members Only
JC Parets Risk Reversal In Small-caps Small-cap stocks are back down to where they bottomed out last summer. Can they do it again? I believe they can, and that's the... May 11, 2023 Stocks ASC ASC Chart of the Day
JC Parets Hestia Capital Raises Its PBI Stake to 9% The largest insider transaction on today’s Hot List is a Form 4 filing by Pulse Biosciences $PLSE director Robert W. Duggan. Duggan reported a purchase worth roughly $65 million in PLSE. May 11, 2023 Stocks Strazza The Hot List
JC Parets Swing Trader Pro: Morning Briefing (05-11-2023) From the Desk of Kimmy Sokoloff It's just like Tuesday... With PPI coming up at 8:30 a.m. ET, I'm going to hold off on sharing ideas until I see how the market reacts. May 11, 2023 Stocks Swing Trader Pro Newsletter
Alfonso De Pablos, CMT 2 to 100 Club (05-10-2023) From the Desk of Steve Strazza @Sstrazza Welcome to the 2 to 100 Club. As many of you know, something we've been working on internally is using various bottom-up tools and... May 10, 2023 All Star Charts Premium 2 to 100 Club Premium Stocks ASC Strazza 2-to-100 Club Members Only
Patrick Dunuwila Daily Chart Report 📈 Wednesday, May 10, 2023 May 10, 2023 The Chart Report Uncategorized Daily Chart Report Front Top Content Featured Stories
JC Parets Swing Trader Pro: Afternoon Briefing (05-10-2023) From the Desk of Kimmy Sokoloff What a day... $SPY came close to the 415 level I mentioned this morning and then traded below 410. ... May 10, 2023 Stocks Swing Trader Pro Newsletter
Patrick Dunuwila Chart of the Day - Wednesday, May 10, 2023 May 10, 2023 The Chart Report Uncategorized Momentum $SPX Todd Sohn TCR Chart of the Day
Sean McLaughlin [Options] It's Now or Never, Smalls [9/7: updated stop to 180. We're already #FreeRiding, so whatever we sell for is pure profit!] It's time for the small caps to make a stand. The time is now. If they don't, it could be 'goodnight' for a long time. ... May 10, 2023 All Options Options Premium ASC
Sean McLaughlin [Options P2P] New Position: XLV The next new position in our Paid-to-Play portfolio is: May 10, 2023 Options Paid to Play Paid To Play Members Only
Sean McLaughlin [Options P2P] Trade Alert: Exited XLP For a Profit We had a resting GTC order filled at our profit target in the Paid-to-Play portfolio today: May 10, 2023 Options Paid to Play Paid To Play Members Only
JC Parets Insiders Scoop Up EVA, USB, and SOFI Shares The largest insider transaction on today’s Hot List is a Form 4 filing by Enviva Inc $EVA director John Bumgarner Jr. Bumgarner reported a purchase worth roughly $1.8 million in EVA. May 10, 2023 Stocks Strazza The Hot List
JC Parets Swing Trader Pro: Morning Briefing (05-10-2023) From the Desk of Kimmy Sokoloff CPI data for April will be released at 8:30 a.m. ET. I'll hold off on ideas until I see how the market reacts. May 10, 2023 Stocks Swing Trader Pro Newsletter
JC Parets Inside Scoop Weekly Strategy Session - May 10, 2023 This is the video recording of the May 10, 2023, Inside Scoop Weekly Strategy Session. May 10, 2023 Hot Corner Insider Stocks Strazza Inside Scoop Inside Scoop Strategy Session Inside Scoop Strategy Session Members Only
Patrick Dunuwila Daily Chart Report 📈 Tuesday, May 9, 2023 May 9, 2023 The Chart Report Uncategorized Daily Chart Report Front Top Content Featured Stories
The Morning Show The Morning Show - March 16, 2026 March 16, 2026 Hosted by Spencer Israel JC Parets Steve Strazza With special guest(s) Kenny Glick Michael Batnick Jason Perz
The Morning Show The Morning Show - March 13, 2026 March 13, 2026 Hosted by Spencer Israel JC Parets Steve Strazza With special guest(s) Kenny Glick Sam Ro Louis Sykes
Options Jam Session Options Strategy Deep Dive: What Traders Need to Know March 12, 2026 Hosted by Sean McLaughlin