Offense Breaks the Trendline, Defense Breaks a Sweat💥
By Grant Hawkridge
June 26, 2025
Today's number is... 8
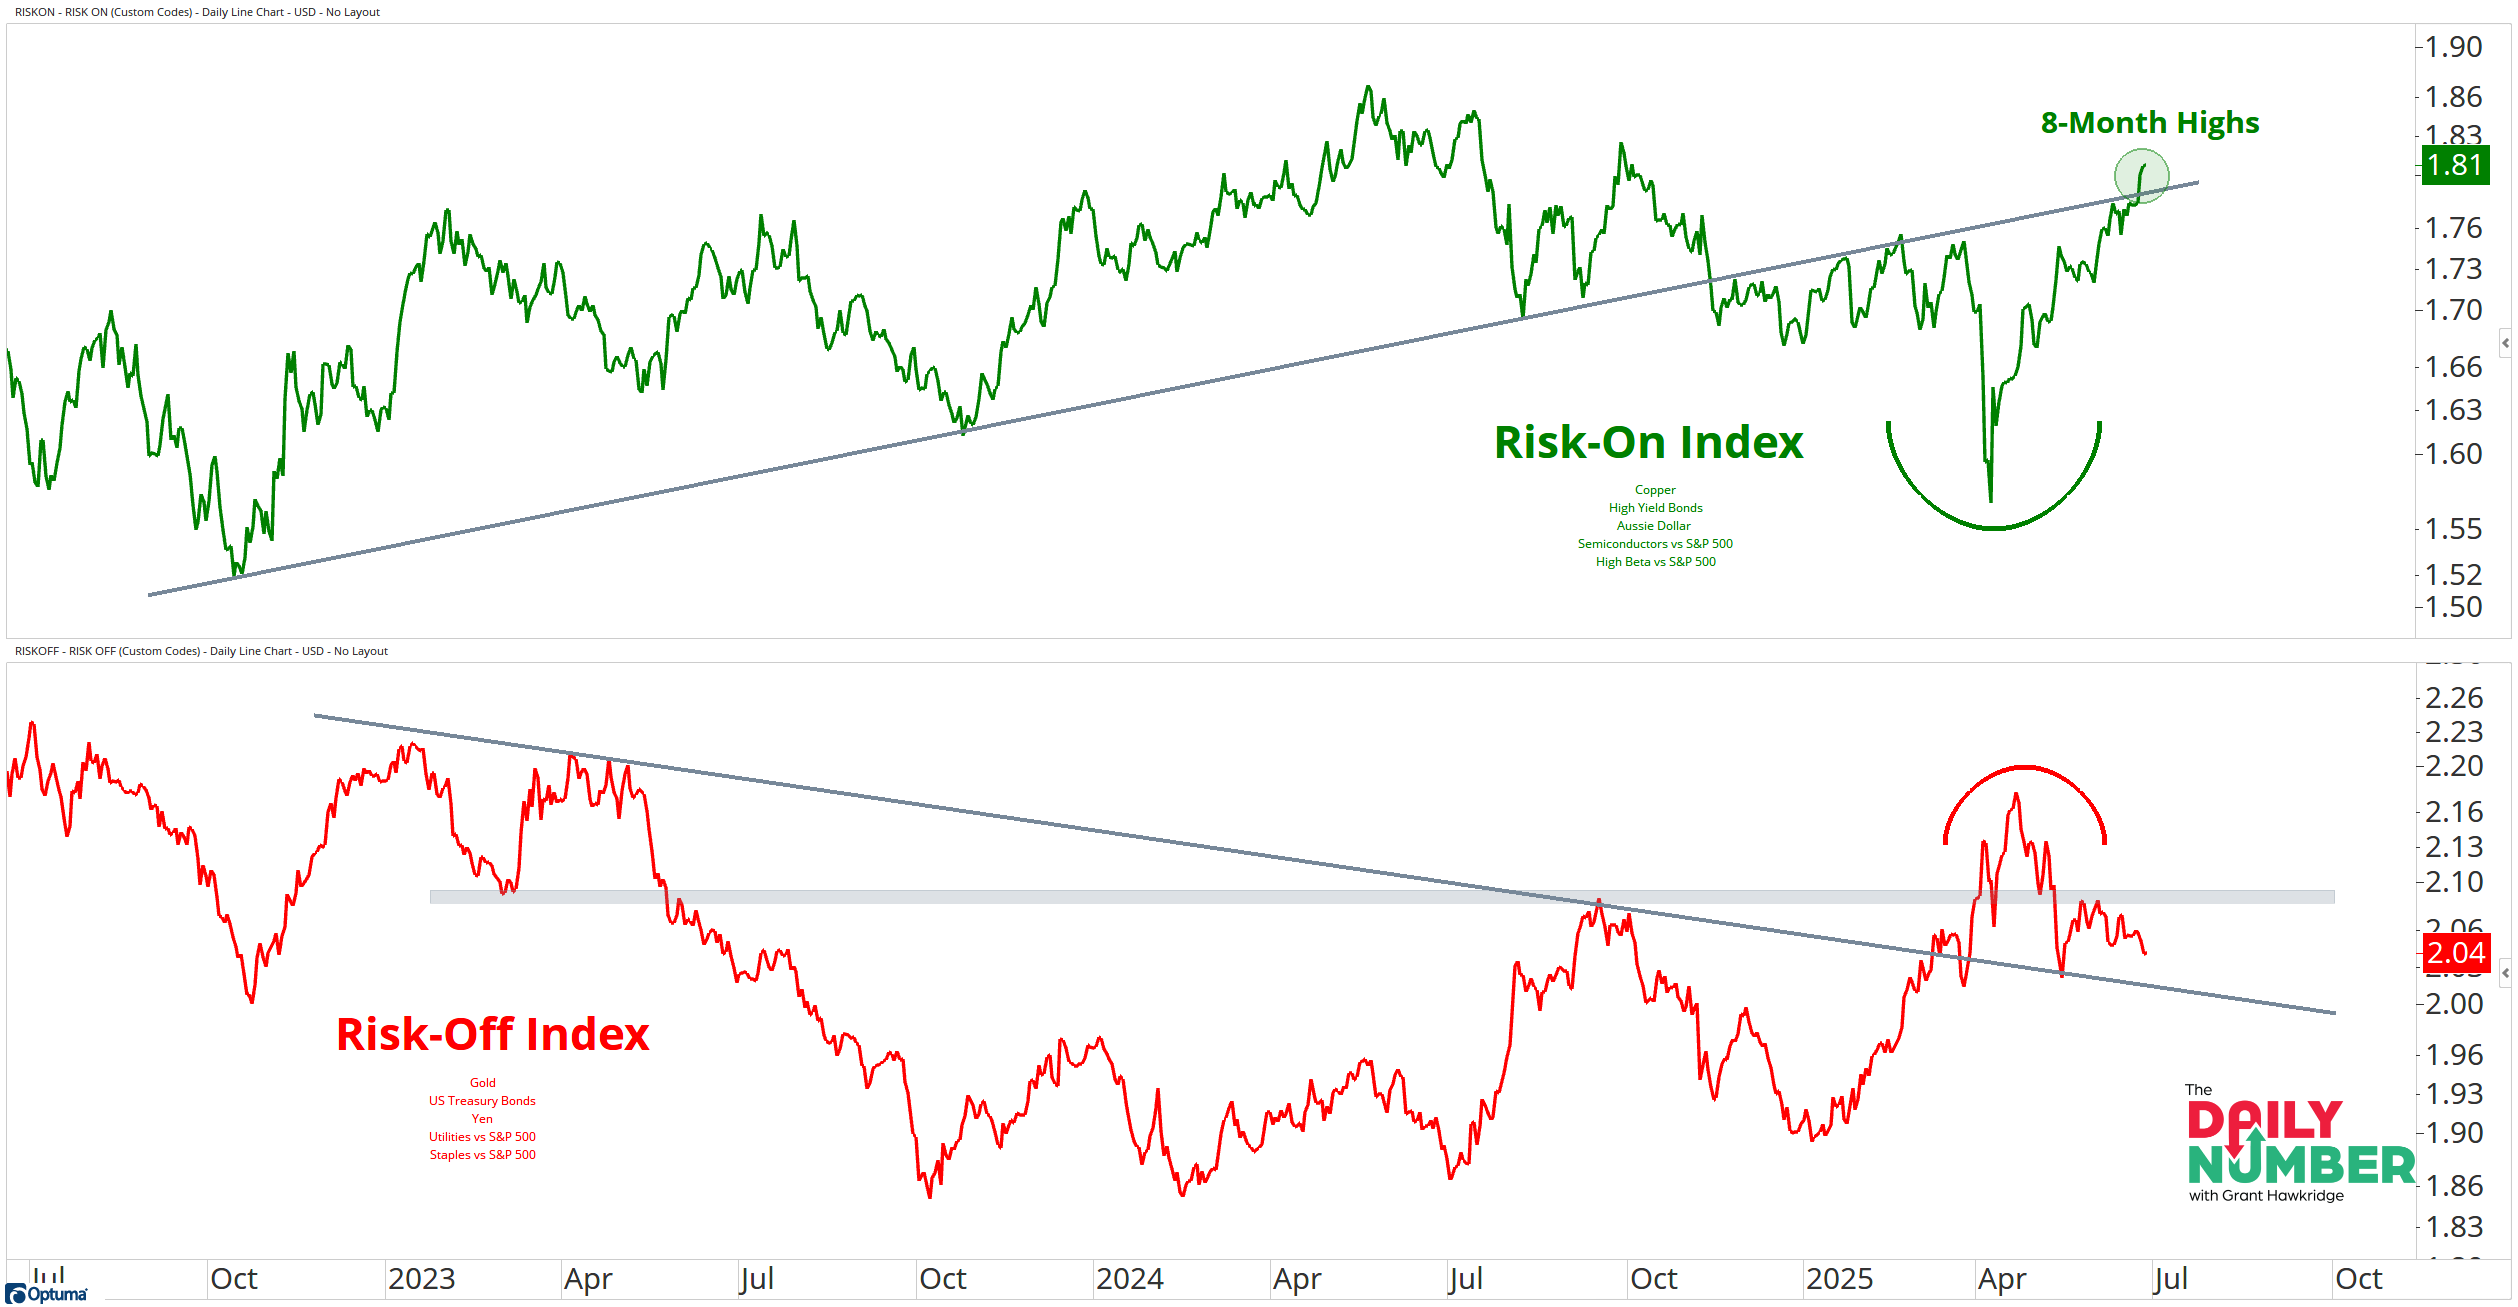
That’s a new 8-month high for my custom Risk-On Index — and it just broke above a key trendline.
Here’s the chart:
Let's break down what the chart shows:
The green line in the top panel is my custom Risk-On Index.
The red line in the bottom panel is my custom Risk-Off Index.
The Takeaway:The Risk-On Index is a clean gauge of risk appetite that blends key assets like copper, high-yield bonds, the Aussie dollar, semiconductors, and high beta.
And right now, it’s sending a clear message — buyers are getting aggressive.
Meanwhile, the Risk-Off Index is heading in the opposite direction. After failing to hold above a key support and resistance level, it’s rolling over again — but hasn’t yet broken below its own trendline.
Together, they signal a clear shift in positioning: away from defense and back toward risk.
The last time we saw this kind of dual confirmation was late 2022. That marked the start of a brand new bull market in equities.
So, if the Risk-Off Index confirms with a fresh trendline breakdown, it could open the door to a broader rotation into growth, cyclicals, and high beta stocks.
Risk-On assets have shown their hand.
Now it’s the defensive side’s turn to confirm.
Is this the start of a full-blown rotation — or just a head fake?
Grant Hawkridge | Chief Aussie Operator, All Star Charts
From breakout setups to sector rotation, we cover what matters. With Premium, you get curated watchlists like the “Hall of Famers” and “Freshly Squeezed” — plus our take on what to do with them. Stay on top of the action and trade with confidence.
If you find my content valuable, I would greatly appreciate it if you could share it with your friends, family, and colleagues. Your help in spreading the word is invaluable in supporting our work. Thank you to all of you who share!
If you ever feel overwhelmed by the amount of financial data that comes out every minute of every day, we've got you covered. The Daily Number - Our top data point each market day.