802 Days In, And This Bull Market Is Still Below Average ⏱️
By Grant Hawkridge
December 24, 2025
Today's number is... 802
The current S&P 500 bull market has been running for 802 trading days.
Here’s the chart:
Let's break down what the chart shows:
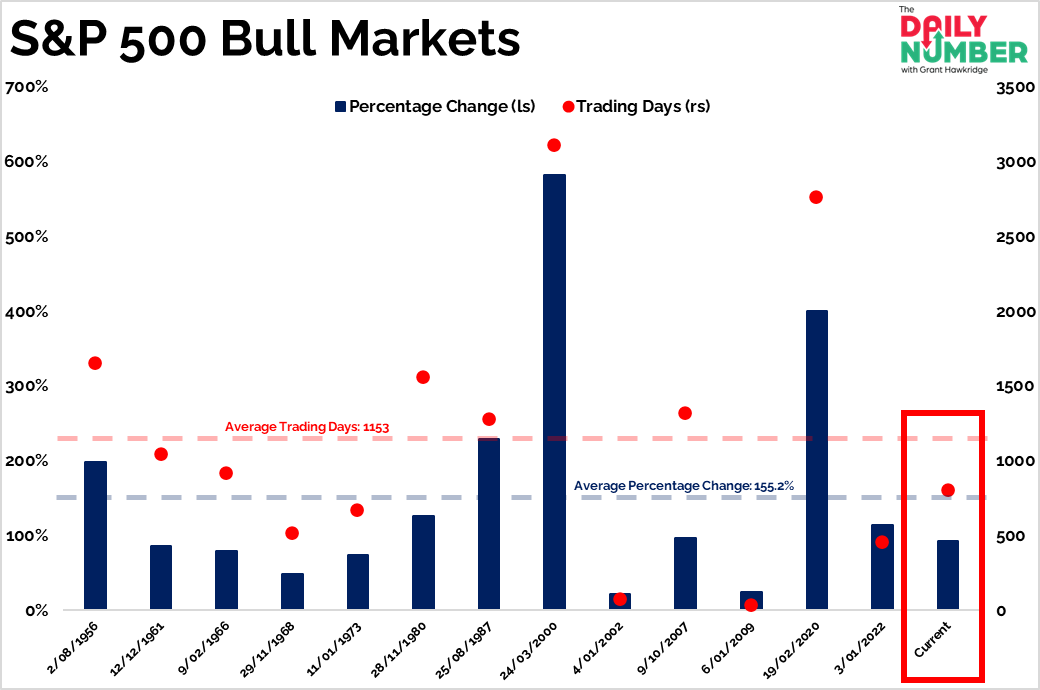
The chart displays S&P 500 bull markets dating back to 1950.
Dark blue bars represent the total percentage gain of each bull market on the left axis.
The dark blue dashed horizontal line marks the average bull market gain of 155.2%.
Red dots represent the number of trading days for each bull market on the right axis.
The red dashed horizontal line marks the average bull market length of 1153 trading days.
The Takeaway: This bull market is still early by historical standards.
Bull markets defined by a –20% drawdown followed by a +20% rally have averaged 1153 trading days. The current run sits at 802 days. More than 350 days remain before it even reaches that average.
The S&P 500 is up 93.2% from the October 2022 low. The average bull market gain sits at 155.2%. This cycle has delivered a strong advance, but it remains well below where past bull markets have ended.
History does not say this move is done just yet.
Yesterday’s move marked the S&P 500’s 38th all-time high of 2025, a pace well above the long-term average, with the index already up 17.5% this year.
Markets that are ending do not deliver gains like this while printing new all-time highs. They stall, roll over, and stop moving higher.
What we are seeing right now is how a strong primary trend behaves.
So, what about 802 trading days says this bull market is finished?
If you find my content valuable, I would greatly appreciate it if you could share it with your friends, family, and colleagues. Your help in spreading the word is invaluable in supporting our work. Thank you to all of you who share!