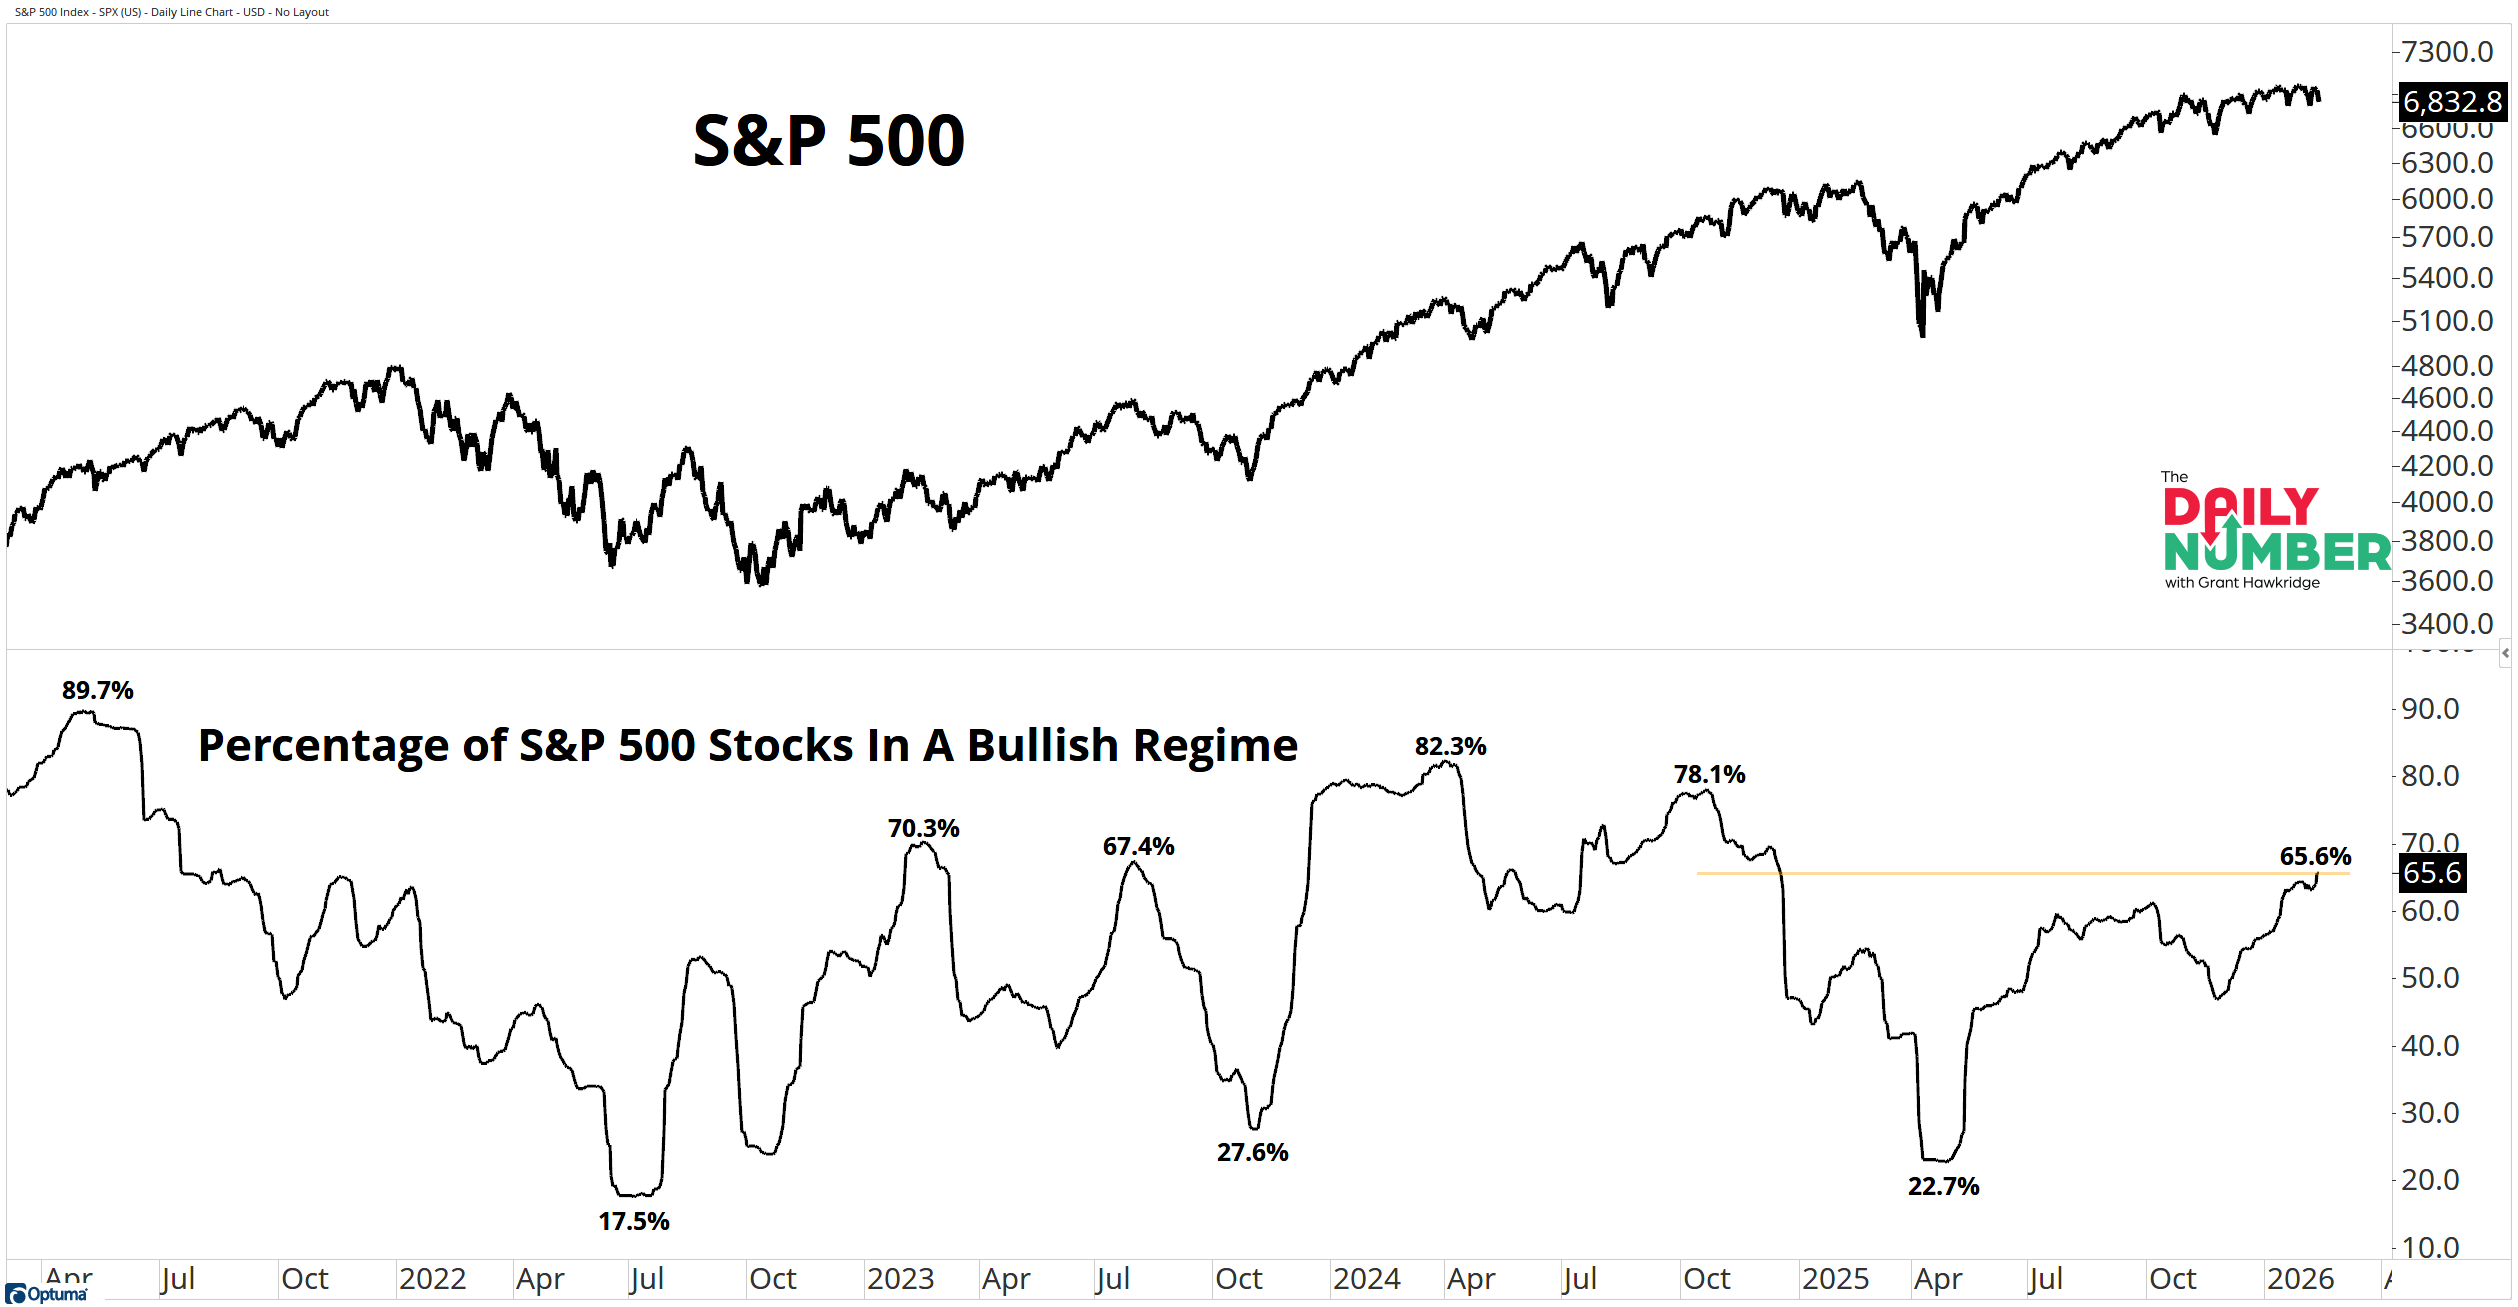
65.6% of S&P 500 stocks are in a bullish RSI regime.
Here’s the chart:
Let's break down what the chart shows:
The top section displays the S&P 500 index in black.
The lower section displays the percentage of S&P 500 stocks in a bullish regime in black
The Takeaway: 65.6% means almost two-thirds of the index has hit RSI 70 more recently than 30. Upside momentum has spread across most stocks. This is the highest reading since December 2024.
In April 2025, participation collapsed to 22.7%, with nearly 80% of stocks flipped into bearish RSI regimes. Since then, the number has climbed 43 points to 65.6%. That is momentum rotating back to the upside across most of the index, not strength confined to a narrow pocket.
Right now, the average S&P 500 stock carries an RSI of 52.7. That sits in the middle of the range. Momentum is positive, but it is nowhere near overbought territory. There is still fuel left in this move.
With more than half the index in bullish regimes, upside momentum is broad. This is expansion across stocks, not concentration in leadership.
So, how far can participation expand before it overheats?
If you find my content valuable, I would greatly appreciate it if you could share it with your friends, family, and colleagues. Your help in spreading the word is invaluable in supporting our work. Thank you to all of you who share!