Software is down 21% from its highs, while semiconductors sit at all-time highs.
Here’s the chart:
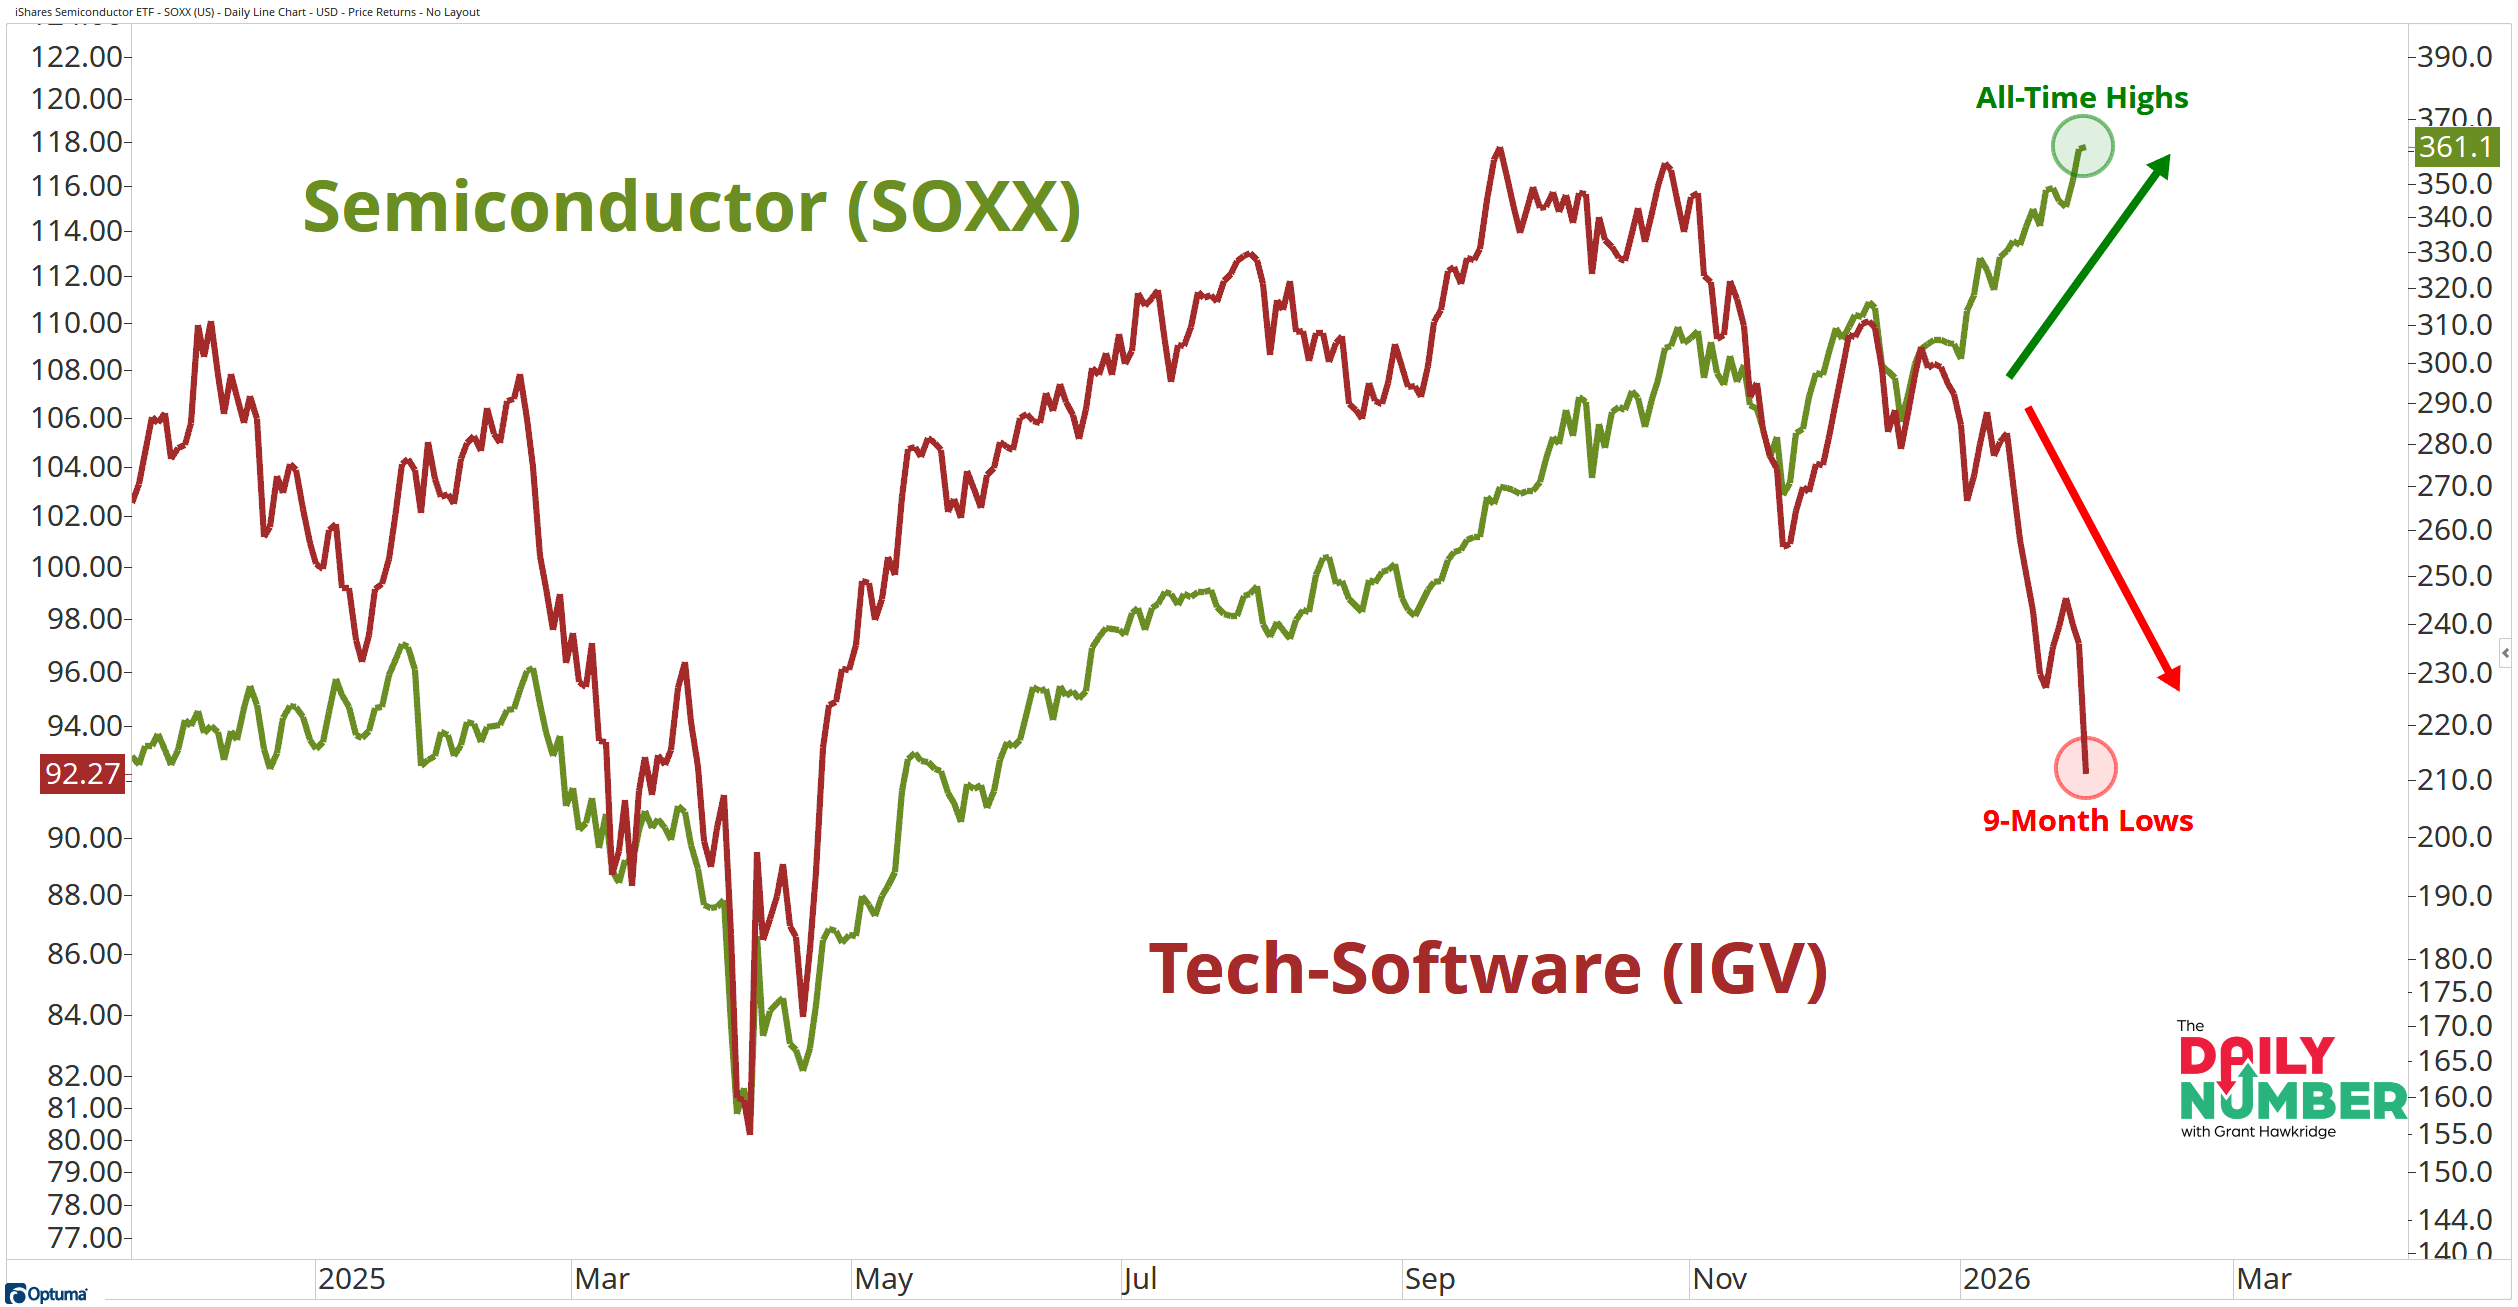
Let's break down what the chart shows:
The chart displays two price lines over the same period.
The green line tracks the Semiconductor ETF (SOXX).
The red line tracks the Tech-Software ETF (IGV).
The Takeaway: A 21% drawdown in software sits next to all-time highs in semiconductors.
Two groups inside the technology sector are moving in opposite directions at the same time.
Semiconductors are trading at the highest level ever recorded. Buyers keep paying higher prices. That is what leadership looks like when money wants exposure.
Software trades 21% below its prior high. That meets the Street definition of a bear market. Price keeps pressing lower. Money is leaving, not rotating sideways.
Both groups live inside the same sector, but price does not reward them equally. Money is flowing toward what is trending higher and away from what is breaking down.
So, this is a great example that today's market is not a buy-everything market.
One pocket of tech drives gains while another bleeds quietly in the background.
This type of environment punishes lazy positioning.
The edge right now comes from staying with what's near their highs and stepping aside from what is not.
So, are you positioned in the part of tech making new highs, or stuck defending a 21% drawdown?
If you find my content valuable, I would greatly appreciate it if you could share it with your friends, family, and colleagues. Your help in spreading the word is invaluable in supporting our work. Thank you to all of you who share!