The ETF Canary In The Coal Mine Composite Trend Position Score is 100%, and the Trend Direction Score is also 100%.
Here’s the chart:
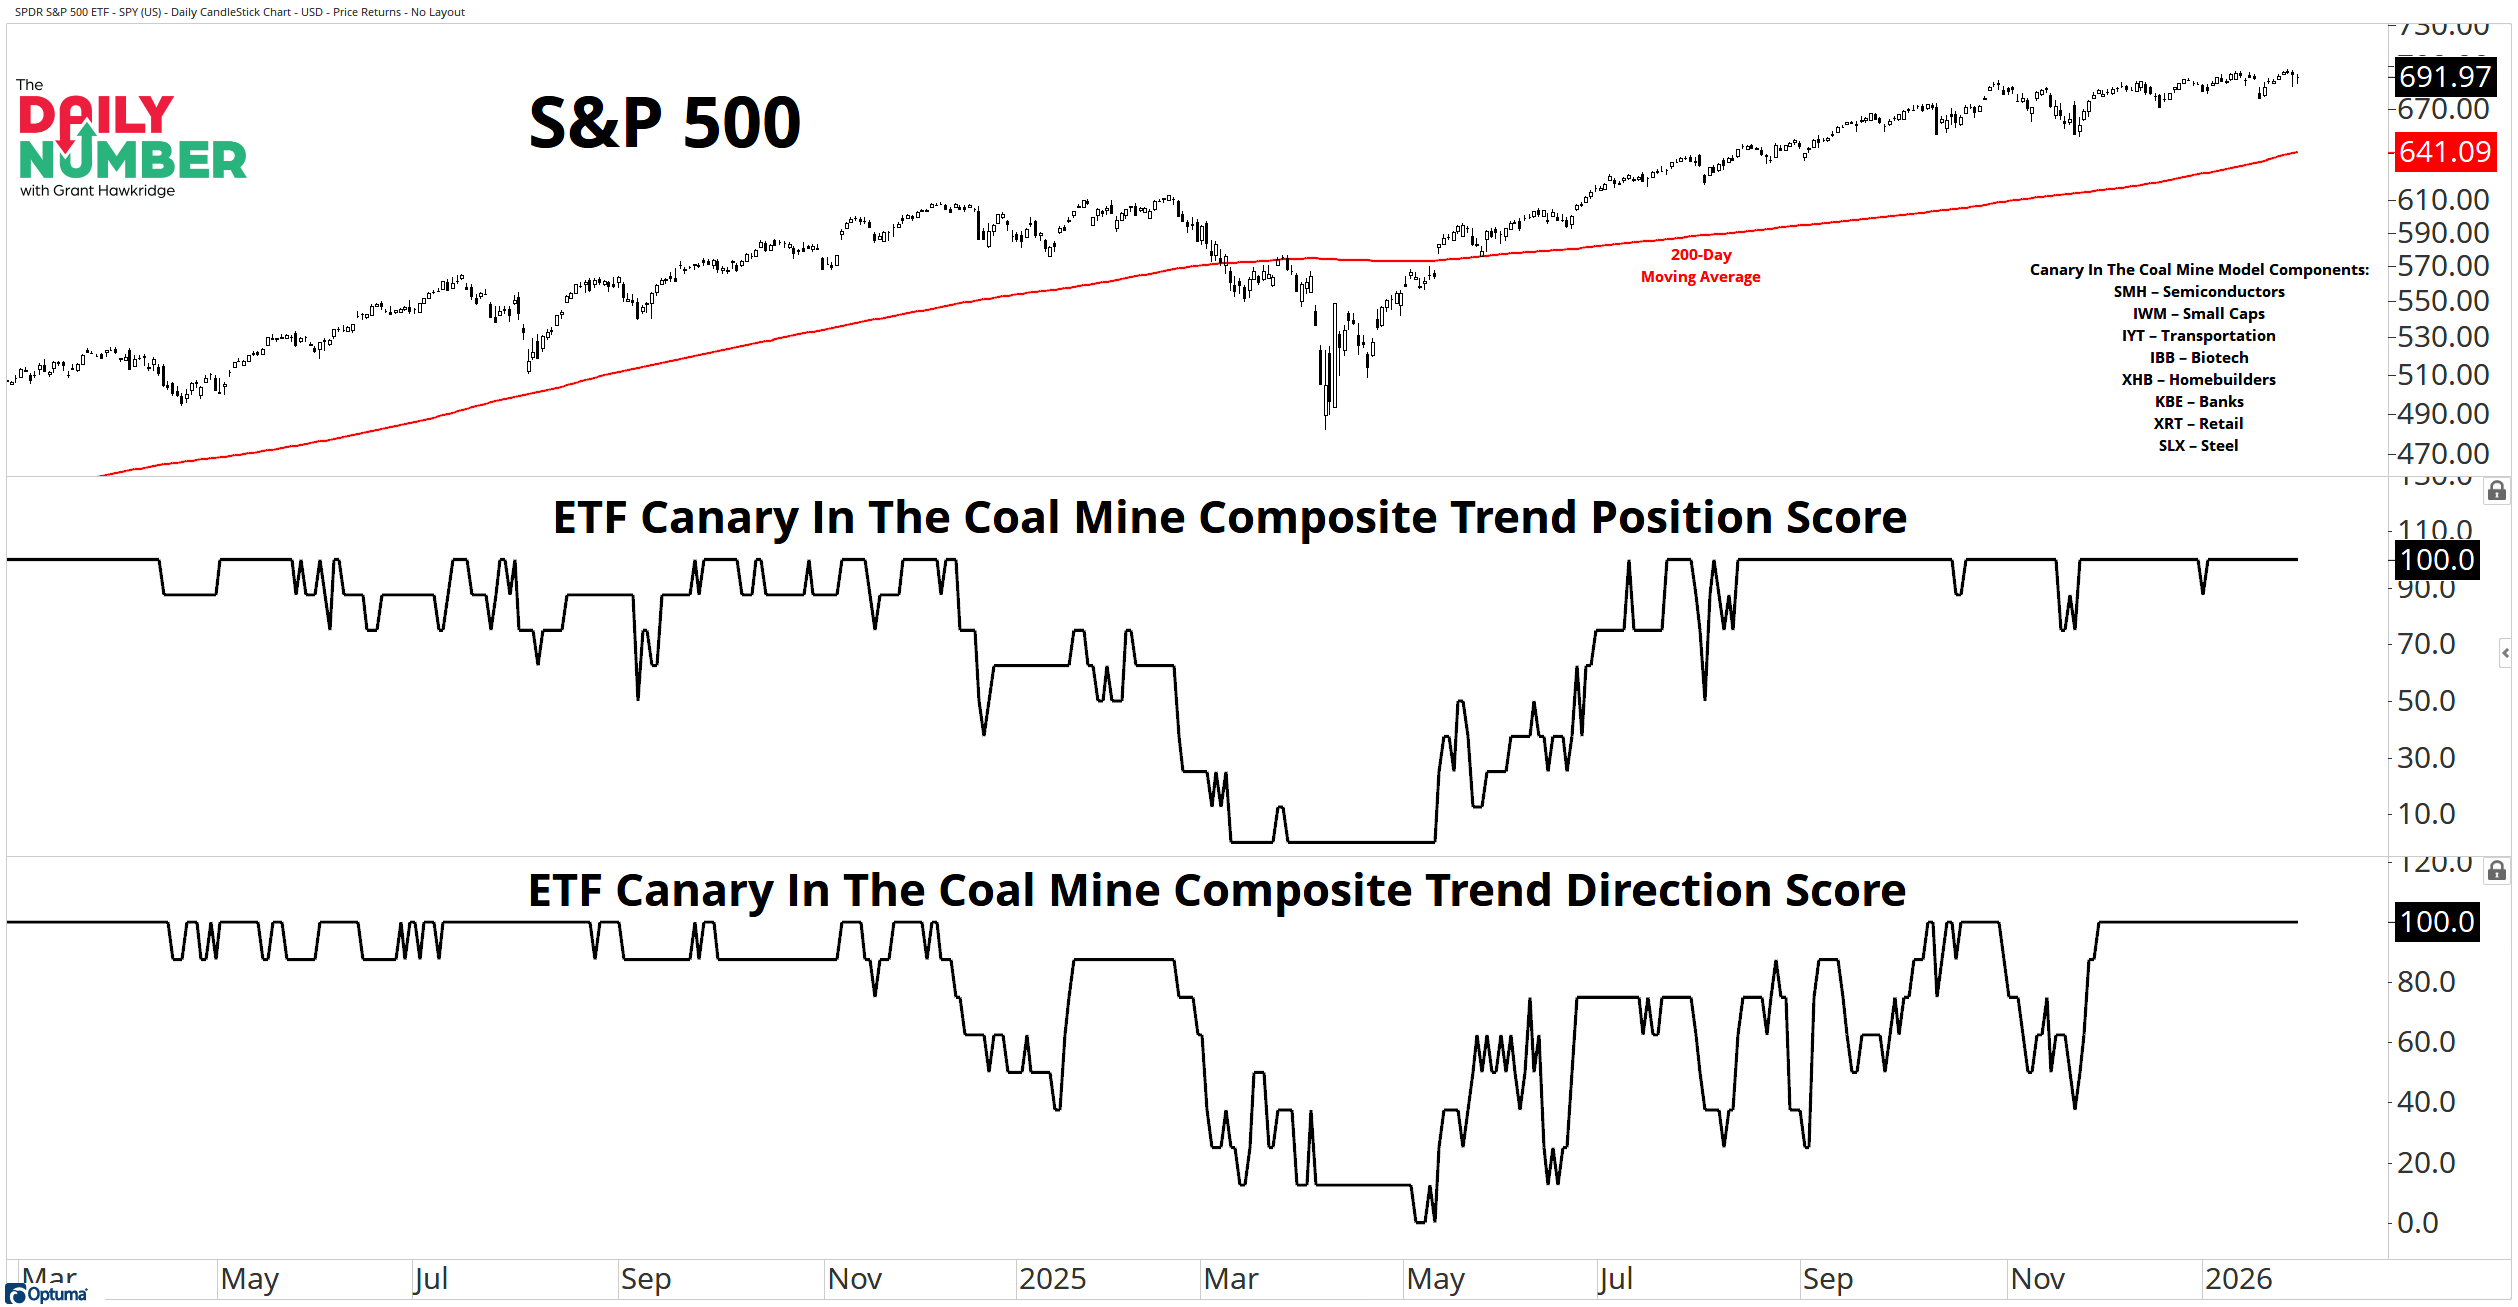
Let's break down what the chart shows:
The top panel displays the S&P 500 in black. A red line marks the 200-day moving average.
The middle panel displays the ETF Canary In The Coal Mine Composite Trend Position Score as a black line.
The bottom panel displays the ETF Canary In The Coal Mine Composite Trend Direction Score as a black line.
The Takeaway: The Trend Position Score is 100%.
The Trend Direction Score is 100%.
Every ETF inside this model is above its long-term trend, and that trend is still rising.
This is bullish. There is no way around it. When markets are about to roll over, this does not happen. Risk-sensitive areas slip first. These scores do not sit pinned at the ceiling while the index quietly tops.
If downside risk was building for the S&P 500, it would already be visible here. That is how stress shows up. None of that is happening right now.
Instead, every risk-sensitive ETF in this composite remains in an uptrend. Not most of them. All of them. Buyers are still accepting higher prices.
That does not mean price cannot pull back. It does mean those pullbacks are not coming from internal weakness.
This is what strength looks like underneath the surface, even when headlines feel noisy.
This model only changes when risk actually leaves the market. Until these scores move off 100%, the burden of proof stays with the bears.
So, with both scores at 100%, what exactly is the case for selling strength?
If you find my content valuable, I would greatly appreciate it if you could share it with your friends, family, and colleagues. Your help in spreading the word is invaluable in supporting our work. Thank you to all of you who share!