Steve Strazza Alfonso De Pablos, CMT [Premium] Mid-Month Strategy Session - February 2026 February 17, 2026 All Star Charts Premium Members Only Search Displaying 10105 - 10128 of 20797 JC Parets Swing Trader Pro: Afternoon Briefing (02-09-2023) From the Desk of Kimmy Sokoloff It was a wild day, once again. I thought we were going to have movement higher if we were able to break above $SPY... February 9, 2023 Stocks Swing Trader Pro Newsletter Ian Culley All Quiet on the Bond Front From the Desk of Ian Culley Markets don’t always trend higher or lower. In fact, traders often deal with churn – which sometimes is nothing more than a range-bound mess. "Sideways" is a trend that's all too easy to forget... February 9, 2023 All Star Charts Premium Premium bonds ASC Ian Bond Report Members Only JC Parets [PLUS] Weekly Town Hall w/ Willie Delwiche This is the video recording of the February 9th, 2023, Weekly Town Hall w/ Willie Delwiche. 2/9/23 2:00 PM ET February 9, 2023 willie plus town hall meeting Steve Strazza Freshly Squeezed Report From the Desk of Steve Strazza @Sstrazza As our Premium Members already know, we have a laundry list of scans that we run internally on an almost daily basis. Different market environments, naturally, are more conducive to... February 9, 2023 All Star Charts Premium Premium Stocks ASC Strazza Freshly Squeezed Members Only Louis Sykes Fibonacci Levels in Polygon Have you figured it out yet? Is Bitcoin about to roll over here? Or are we flagging before the next run-up? The beauty of this game is that we don't need to predict the future... February 9, 2023 All Star Charts Crypto Crypto Crypto Blog Members Only Patrick Dunuwila Chart of the Day - Thursday, February 9th, 2023 February 9, 2023 The Chart Report Seasonality $SPX Ryan Detrick TCR Chart of the Day Sean McLaughlin [Options P2P] New Position: ITB The next new position in our Paid-to-Play portfolio is: February 9, 2023 Options Paid to Play Paid To Play Members Only Sean McLaughlin [Options P2P] Trade Alert: Exited EEM Position We had a resting GTC order filled at our profit target in the Paid-to-Play portfolio today: February 9, 2023 Options Paid to Play Paid To Play Members Only Sean McLaughlin [Options P2P] Trade Alert: Exited SLV for a Profit We had a resting GTC order filled at our profit target in the Paid-to-Play portfolio today: February 9, 2023 Options Paid to Play Paid To Play Members Only JC Parets Three CEOs Report Share Buys The largest insider buy on today’s list is a Form 4 filing by Charles Magro, the CEO of chemical and seed company Corteva $CTVA. Magro reported a purchase of 40,000 shares, equivalent to $2.4 million. February 9, 2023 Stocks Strazza The Hot List JC Parets Swing Trader Pro: Morning Briefing (02-09-2023) From the Desk of Kimmy Sokoloff The whipsaws that have been occurring in this market this past year are extreme. One day down, the next back up. This morning, futures are higher. It's basically negated yesterday's down move... February 9, 2023 Stocks Swing Trader Pro Newsletter Sean McLaughlin Relatively Speaking February 8, 2023 All Options ASC Paid To Play Steve Strazza The Short Report (02-08-2023) From the Desk of Steve Strazza @Sstrazza When investing in the stock market, we always want to approach it as "a market of stocks." Regardless of the environment, there are always stocks showing leadership and trending higher... February 8, 2023 All Star Charts Premium Premium Stocks ASC Strazza Grant Short Report Members Only Patrick Dunuwila Daily Chart Report ? Wednesday, February 8th, 2023 February 8, 2023 The Chart Report Daily Chart Report Front Top Content Featured Stories JC Parets Swing Trader Pro: Afternoon Briefing (02-08-2023) From the Desk of Kimmy Sokoloff Volatility reigns! Overall, the market consolidated but really couldn't decide if it wanted higher or lower. February 8, 2023 Stocks Swing Trader Pro Newsletter JC Parets [PLUS] Weekly Sentiment Report: Seeing Is Believing From the desk of Willie Delwiche. Bulls on the Investors Intelligence survey continued to climb while bears fell... February 8, 2023 willie plus sentiment Sentiment Report JC Parets Inside Scoop Weekly Strategy Session - February 8, 2023 This is the video recording of our February 8, 2023, Inside Scoop Weekly Strategy Session. February 8, 2023 Hot Corner Insider Stocks Strazza Inside Scoop Inside Scoop Strategy Session Inside Scoop Strategy Session Members Only Sean McLaughlin [Options] Big Daddy Hack Whoa baby. This might be a fun one. Or not. Either way, we'll likely find out pretty quickly. Chinese stocks continue to offer up interesting opportunities. And today's trade is no exception. And to play it, we're going to do it in a fairly... February 8, 2023 All Options Options Premium ASC Patrick Dunuwila Chart of the Day - Wednesday, February 8th, 2023 February 8, 2023 The Chart Report $SPX S&P 500 TCR Chart of the Day $SPY Sean McLaughlin [Options P2P] New Position: XRT The next new position in our Paid-to-Play portfolio is: February 8, 2023 Options Paid to Play Paid To Play Members Only Louis Sykes What Will It Be? Crypto markets can be daunting for those who come from traditional backgrounds. There are entirely new market mechanisms, trading hours, different exchanges, and distinct ways to analyze the market, let alone the decentralized nature of how... February 8, 2023 ASC Crypto JC Parets An SMCI Director Is Buying Shares The most significant insider buy on today's list is a Form 4 filed by Super Micro Computer $SMCI Director Shiu Leung Chan. Chan reported a $256,440 purchase of SMCI. February 8, 2023 Stocks Strazza The Hot List JC Parets Swing Trader Pro: Morning Briefing (02-08-2023) From the Desk of Kimmy Sokoloff The market finished strong yesterday, and we just might need a little breather before the next move. February 8, 2023 Stocks Swing Trader Pro Newsletter JC Parets [Premium] Trade Of The Week This week we're looking into Capital Goods sector stocks. February 8, 2023 India India Premium Trade Of The Week Rashmi Bhatnagar Pagination Back 1 … Page 418 Page 419 Page 420 Page 421 Page 422 Page 423 Page 424 Page 425 Page 426 … 867 Next Recent Episodes What Are My Options? Bring Your Options Trade Ideas. February 17, 2026 Hosted by Sean McLaughlin The Long And Short Of It with Kenny Glick February 17th, 2026 February 17, 2026 Hosted by Kenny Glick The Morning Show for February 17 February 17, 2026 Thompson's Two Cents A Two Trade Market | Software vs. Everybody February 13, 2026 Hosted by Larry Thompson The Morning Show for February 13 February 13, 2026 Crypto After Dark Citadel Just Bought A Crypto February 12, 2026 Hosted by Louis Sykes Missed it? No problem!Replays of all our past episodes are always available in the episode archives. View Episode Archives
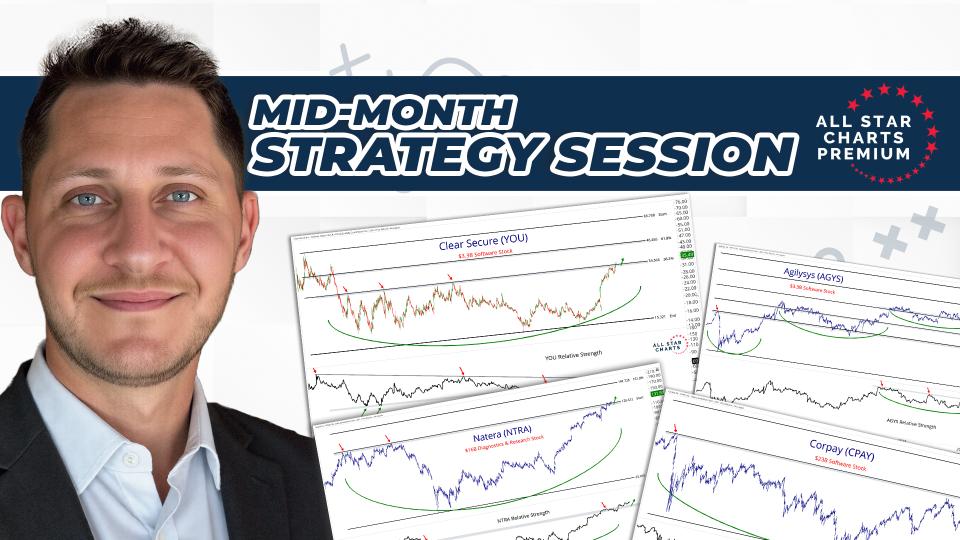
Steve Strazza Alfonso De Pablos, CMT [Premium] Mid-Month Strategy Session - February 2026 February 17, 2026 All Star Charts Premium Members Only
JC Parets Swing Trader Pro: Afternoon Briefing (02-09-2023) From the Desk of Kimmy Sokoloff It was a wild day, once again. I thought we were going to have movement higher if we were able to break above $SPY... February 9, 2023 Stocks Swing Trader Pro Newsletter
Ian Culley All Quiet on the Bond Front From the Desk of Ian Culley Markets don’t always trend higher or lower. In fact, traders often deal with churn – which sometimes is nothing more than a range-bound mess. "Sideways" is a trend that's all too easy to forget... February 9, 2023 All Star Charts Premium Premium bonds ASC Ian Bond Report Members Only
JC Parets [PLUS] Weekly Town Hall w/ Willie Delwiche This is the video recording of the February 9th, 2023, Weekly Town Hall w/ Willie Delwiche. 2/9/23 2:00 PM ET February 9, 2023 willie plus town hall meeting
Steve Strazza Freshly Squeezed Report From the Desk of Steve Strazza @Sstrazza As our Premium Members already know, we have a laundry list of scans that we run internally on an almost daily basis. Different market environments, naturally, are more conducive to... February 9, 2023 All Star Charts Premium Premium Stocks ASC Strazza Freshly Squeezed Members Only
Louis Sykes Fibonacci Levels in Polygon Have you figured it out yet? Is Bitcoin about to roll over here? Or are we flagging before the next run-up? The beauty of this game is that we don't need to predict the future... February 9, 2023 All Star Charts Crypto Crypto Crypto Blog Members Only
Patrick Dunuwila Chart of the Day - Thursday, February 9th, 2023 February 9, 2023 The Chart Report Seasonality $SPX Ryan Detrick TCR Chart of the Day
Sean McLaughlin [Options P2P] New Position: ITB The next new position in our Paid-to-Play portfolio is: February 9, 2023 Options Paid to Play Paid To Play Members Only
Sean McLaughlin [Options P2P] Trade Alert: Exited EEM Position We had a resting GTC order filled at our profit target in the Paid-to-Play portfolio today: February 9, 2023 Options Paid to Play Paid To Play Members Only
Sean McLaughlin [Options P2P] Trade Alert: Exited SLV for a Profit We had a resting GTC order filled at our profit target in the Paid-to-Play portfolio today: February 9, 2023 Options Paid to Play Paid To Play Members Only
JC Parets Three CEOs Report Share Buys The largest insider buy on today’s list is a Form 4 filing by Charles Magro, the CEO of chemical and seed company Corteva $CTVA. Magro reported a purchase of 40,000 shares, equivalent to $2.4 million. February 9, 2023 Stocks Strazza The Hot List
JC Parets Swing Trader Pro: Morning Briefing (02-09-2023) From the Desk of Kimmy Sokoloff The whipsaws that have been occurring in this market this past year are extreme. One day down, the next back up. This morning, futures are higher. It's basically negated yesterday's down move... February 9, 2023 Stocks Swing Trader Pro Newsletter
Steve Strazza The Short Report (02-08-2023) From the Desk of Steve Strazza @Sstrazza When investing in the stock market, we always want to approach it as "a market of stocks." Regardless of the environment, there are always stocks showing leadership and trending higher... February 8, 2023 All Star Charts Premium Premium Stocks ASC Strazza Grant Short Report Members Only
Patrick Dunuwila Daily Chart Report ? Wednesday, February 8th, 2023 February 8, 2023 The Chart Report Daily Chart Report Front Top Content Featured Stories
JC Parets Swing Trader Pro: Afternoon Briefing (02-08-2023) From the Desk of Kimmy Sokoloff Volatility reigns! Overall, the market consolidated but really couldn't decide if it wanted higher or lower. February 8, 2023 Stocks Swing Trader Pro Newsletter
JC Parets [PLUS] Weekly Sentiment Report: Seeing Is Believing From the desk of Willie Delwiche. Bulls on the Investors Intelligence survey continued to climb while bears fell... February 8, 2023 willie plus sentiment Sentiment Report
JC Parets Inside Scoop Weekly Strategy Session - February 8, 2023 This is the video recording of our February 8, 2023, Inside Scoop Weekly Strategy Session. February 8, 2023 Hot Corner Insider Stocks Strazza Inside Scoop Inside Scoop Strategy Session Inside Scoop Strategy Session Members Only
Sean McLaughlin [Options] Big Daddy Hack Whoa baby. This might be a fun one. Or not. Either way, we'll likely find out pretty quickly. Chinese stocks continue to offer up interesting opportunities. And today's trade is no exception. And to play it, we're going to do it in a fairly... February 8, 2023 All Options Options Premium ASC
Patrick Dunuwila Chart of the Day - Wednesday, February 8th, 2023 February 8, 2023 The Chart Report $SPX S&P 500 TCR Chart of the Day $SPY
Sean McLaughlin [Options P2P] New Position: XRT The next new position in our Paid-to-Play portfolio is: February 8, 2023 Options Paid to Play Paid To Play Members Only
Louis Sykes What Will It Be? Crypto markets can be daunting for those who come from traditional backgrounds. There are entirely new market mechanisms, trading hours, different exchanges, and distinct ways to analyze the market, let alone the decentralized nature of how... February 8, 2023 ASC Crypto
JC Parets An SMCI Director Is Buying Shares The most significant insider buy on today's list is a Form 4 filed by Super Micro Computer $SMCI Director Shiu Leung Chan. Chan reported a $256,440 purchase of SMCI. February 8, 2023 Stocks Strazza The Hot List
JC Parets Swing Trader Pro: Morning Briefing (02-08-2023) From the Desk of Kimmy Sokoloff The market finished strong yesterday, and we just might need a little breather before the next move. February 8, 2023 Stocks Swing Trader Pro Newsletter
JC Parets [Premium] Trade Of The Week This week we're looking into Capital Goods sector stocks. February 8, 2023 India India Premium Trade Of The Week Rashmi Bhatnagar
The Long And Short Of It with Kenny Glick February 17th, 2026 February 17, 2026 Hosted by Kenny Glick
Thompson's Two Cents A Two Trade Market | Software vs. Everybody February 13, 2026 Hosted by Larry Thompson


