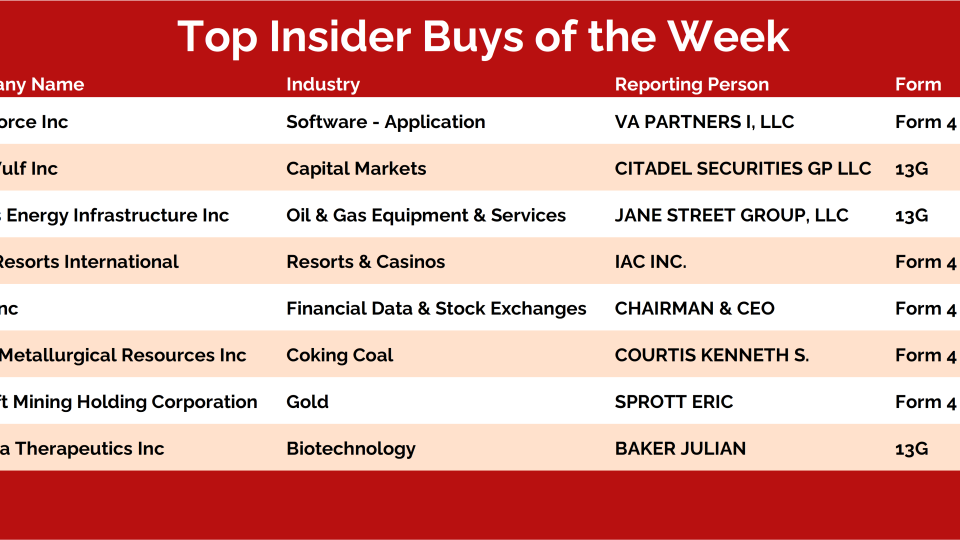
Every weekend, I dig into our insider activity tracker looking for the biggest conviction buys — and this week checked all the boxes: Baker Bros, coal stocks, big software bets, and precious metals.
Every weekend, I dig into our insider activity tracker looking for the biggest conviction buys — and this week checked all the boxes: Baker Bros, coal stocks, big software bets, and precious metals.
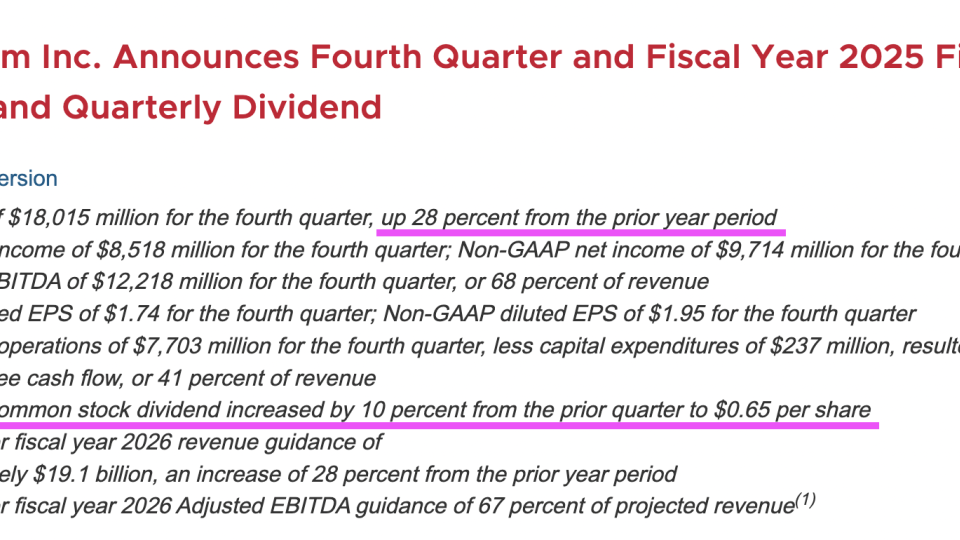
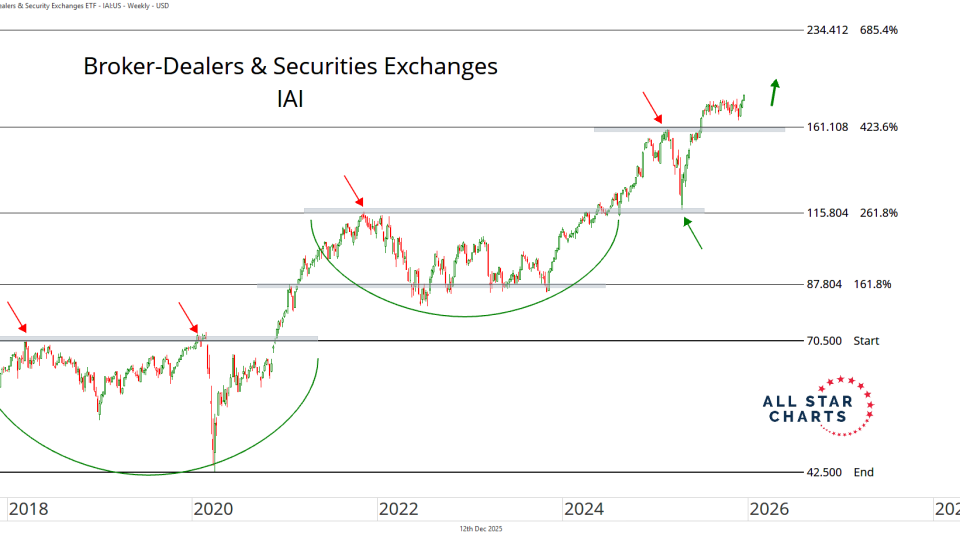
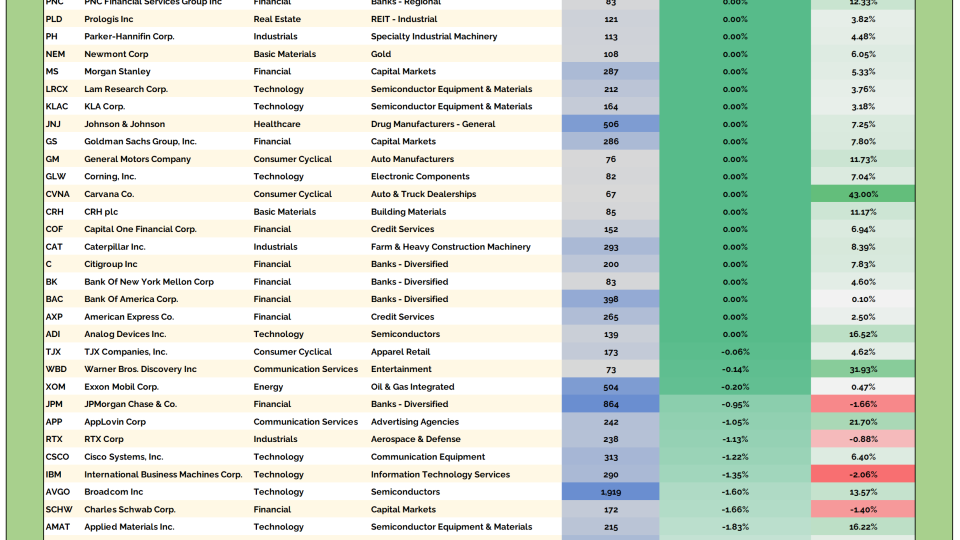
The credit card business has always been a good business. Collecting fees on every swipe where the vast majority of transactions are done via credit card? Sign me up.
Clearly it's been good for American Express and it appears to be getting...
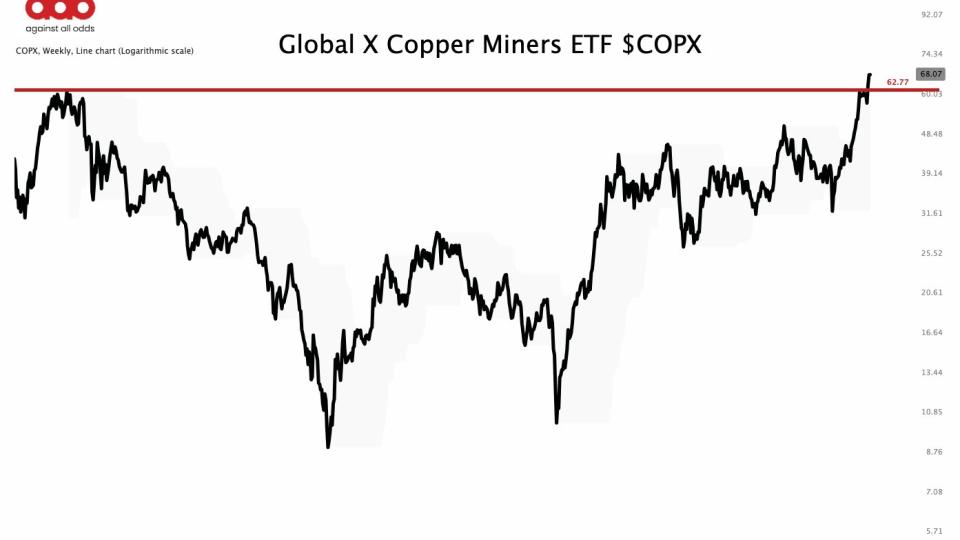
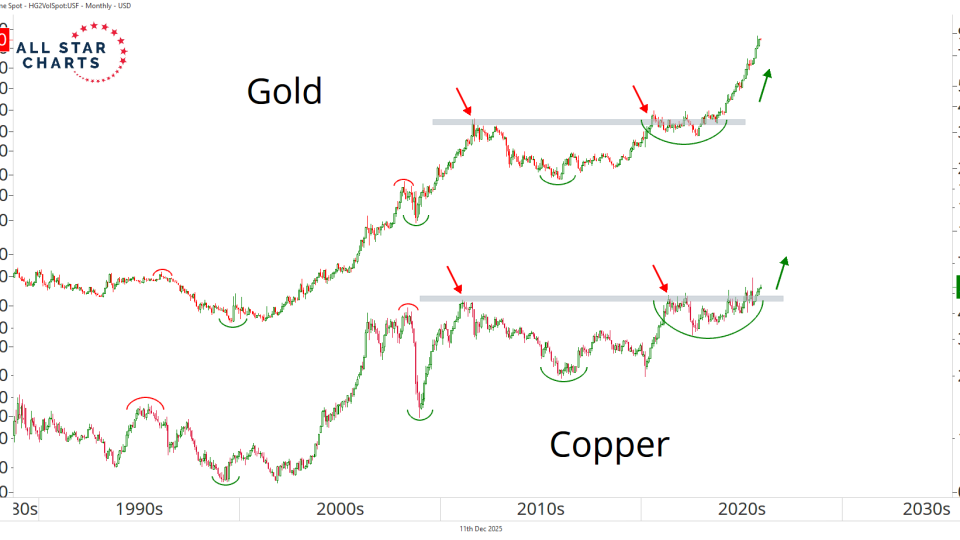
Base metals are entering a brand-new primary uptrend.
This entire year, we’ve been pounding the table on one idea: investors are wildly underestimating the structural shift unfolding inside base and industrial metals.
The most sophisticated Biotech Investors Are Buying a Fresh Breakout
Every day, we sift through the filings to spot where the real conviction lies – cutting through the noise to highlight the most meaningful insider moves.
📌 Hycroft Mining $HYMC — Eric Sprott disclosed a...