Grant Hawkridge Thirty Stocks. Thirty Stories. One Index. 🧭 Today's number is... 30 30 Dow stocks are heading into the final weeks of the year, and they are not telling the same story. Here’s the table: Let's break down what the table shows:... December 16, 2025 Search Displaying 9121 - 9144 of 20080 JC Parets Darwin Global Management Ups Its AMAM Stake to 26.4% The biggest Form 4 filing on today's hot list is from Catherine Spear, CEO of FIGS Inc $FIGS. Spear reported the purchase of 790,000 FIGS shares, equivalent to $4.9 million. March 9, 2023 Stocks Strazza The Hot List JC Parets Swing Trader Pro: Morning Briefing (03-09-2023) From the Desk of Kimmy Sokoloff If the market can hold on to yesterday's low, I think there's potential we can head higher. We really need to push past $SPY 400 with force and head straight to 405, then 408... March 9, 2023 Stocks Swing Trader Pro Newsletter Steve Strazza The Short Report (03-08-2023) From the Desk of Steve Strazza @Sstrazza When investing in the stock market, we always want to approach it as "a market of stocks." Regardless of the environment, there are always stocks showing leadership and trending higher... March 8, 2023 All Star Charts Premium Premium Stocks ASC Strazza Grant Short Report Members Only Patrick Dunuwila Daily Chart Report ? Wednesday, March 8th, 2023 March 8, 2023 The Chart Report Daily Chart Report Front Top Content Featured Stories JC Parets Swing Trader Pro: Afternoon Briefing (03-08-2023) From the Desk of Kimmy Sokoloff Fed Chair Jerome Powell spoke again today, but the market could not get going to the upside. The semiconductors have been... March 8, 2023 Stocks Swing Trader Pro Newsletter JC Parets [PLUS] Weekly Sentiment Report: Just Catching Their Breath From the Desk of Willie Delwiche Investors had second thoughts about stocks last week, with sentiment dropping... March 8, 2023 willie plus sentiment Sentiment Report Patrick Dunuwila Chart of the Day - Wednesday, March 8th, 2023 March 8, 2023 The Chart Report Arun Chopra TCR Chart of the Day Nikkei 225 $EWJ Japan Sean McLaughlin [Options] Materially Sideways? Today's trade is going to leverage the rising volatilities introduced into the stock market this week thanks to testimony from the Federal Reserve Chairman (I've been told). When markets get dicey and volatility rises, I like to look... March 8, 2023 All Options Options Premium ASC Sean McLaughlin [Options P2P] New Position: XLU The next new position in our Paid-to-Play portfolio is: March 8, 2023 Options Paid to Play Paid To Play Members Only JC Parets Buffett Is Back To Buy More OXY We’ve been looking out for this filing since last week! Right on time, Uncle Warren strikes again with the Berkshire put in Occidental Petroleum $OXY. March 8, 2023 Stocks Strazza The Hot List JC Parets Swing Trader Pro: Morning Briefing (03-08-2023) From the Desk of Kimmy Sokoloff The market hit the breaks yesterday after Fed Chair Jerome Powell’s speech. Powell is to speak again today, which could make for sloppy trading. March 8, 2023 Stocks Swing Trader Pro Newsletter JC Parets Inside Scoop Weekly Strategy Session - March 8, 2023 This is the video recording of the March 8, 2023, Inside Scoop Weekly Strategy Session. March 8, 2023 Hot Corner Insider Stocks Strazza Inside Scoop Inside Scoop Strategy Session Inside Scoop Strategy Session Members Only Steve Strazza March Strategy Session: 3 Key Takeaways From the desk of Steve Strazza @Sstrazza We held our March Monthly Strategy Session on Monday night. Premium Members can access and rewatch it here. Non-... March 7, 2023 Stocks Intermarktet Analysis ASC Strazza Crypto Ian Culley [Video] What the FICC?: US Dollar Index Rips Higher It's the weekly currency edition of What the FICC? Dollar and rates were big themes last year – rising in tandem – and continue to be as we head into March. It shouldn't come as a surprise as the next chart reveals the crux of the... March 7, 2023 Currencies youtube ASC Ian Currency Report Video Sean McLaughlin It Never Ends March 7, 2023 All Options ASC Ian Culley A Raging Dollar Revives Last Year’s Challenges From the Desk of Ian Culley @IanCulley What year is it? Is it 2023 or 2022? Because it’s starting to feel like last year all over again… No, Will Smith hasn’t slapped anyone (that I’m aware of). And I’m... March 7, 2023 All Star Charts Premium Currencies ASC Ian Currency Report Members Only Patrick Dunuwila Daily Chart Report ? Tuesday, March 7th, 2023 March 7, 2023 The Chart Report Daily Chart Report Front Top Content Featured Stories JC Parets Swing Trader Pro: Afternoon Briefing (03-07-2023) From the Desk of Kimmy Sokoloff That was a very volatile day, as we had Fed Chair Jerome Powell speaking. And he's speaking tomorrow too. March 7, 2023 Stocks Swing Trader Pro Newsletter JC Parets [PLUS] Dynamic Portfolio Management From the desk of Willie Delwiche. Dynamic Portfolio Update: Our asset allocation models are tilting away from commodities, so we sold GLD in our cyclical portfolio (and replaced it... March 7, 2023 willie plus Dynamic Portfolio Management JC Parets [PLUS] March Weight of the Evidence Dashboard: Rally Resilience Will Be Tested From the desk of Willie Delwiche. As good as the market looked in January, it looked that bad in... March 7, 2023 willie plus Weight of the Evidence Patrick Dunuwila Chart of the Day - Tuesday, March 7th, 2023 March 7, 2023 The Chart Report $SPX S&P 500 Moving Averages TCR Chart of the Day Chris Ciovacco Sean McLaughlin [Options P2P] New Position: EFA The next new position in our Paid-to-Play portfolio is: March 7, 2023 Options Paid to Play Paid To Play Members Only JC Parets Know What Game To Play Last night was our Live Conference Call that... March 7, 2023 Stocks Internals ASC breadth JC Parets Co-Founder DeFranco Is Buying DISH Shares The largest insider buy on today's list comes from DISH Network Corporation $DISH co-founder and executive vice-president, James DeFranco. DeFranco revealed a purchase of $15.7 million worth of DISH shares in his latest Form 4. March 7, 2023 Stocks Strazza The Hot List Pagination Back 1 … Page 377 Page 378 Page 379 Page 380 Page 381 Page 382 Page 383 Page 384 Page 385 … 837 Next Recent Episodes Chart Request Live You Request It, We Break It Down. December 15, 2025 With special guest(s) Sam Gatlin Alfonso De Pablos, CMT The Long And Short Of It with Kenny Glick December 15th December 15, 2025 Hosted by Kenny Glick The Morning Show The King Of Seasonality December 15, 2025 Hosted by Spencer Israel JC Parets Steve Strazza With special guest(s) Kenny Glick Jeff Hirsch Sam Gatlin Thompson's Two Cents The Bull Markets Next Step December 12, 2025 Hosted by Larry Thompson The Morning Show It's Crypto Friday on The Morning Show December 12, 2025 Hosted by Spencer Israel JC Parets Steve Strazza With special guest(s) Kenny Glick Louis Sykes Larry Thompson Crypto After Dark The Most Ambitious Crypto Ever? December 11, 2025 Hosted by Louis Sykes Missed it? No problem!Replays of all our past episodes are always available in the episode archives. View Episode Archives
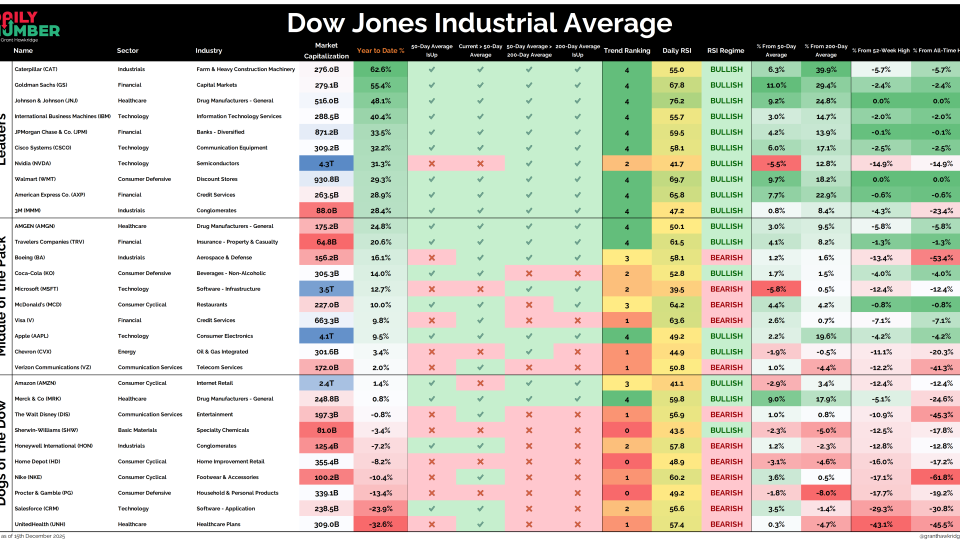
Grant Hawkridge Thirty Stocks. Thirty Stories. One Index. 🧭 Today's number is... 30 30 Dow stocks are heading into the final weeks of the year, and they are not telling the same story. Here’s the table: Let's break down what the table shows:... December 16, 2025
JC Parets Darwin Global Management Ups Its AMAM Stake to 26.4% The biggest Form 4 filing on today's hot list is from Catherine Spear, CEO of FIGS Inc $FIGS. Spear reported the purchase of 790,000 FIGS shares, equivalent to $4.9 million. March 9, 2023 Stocks Strazza The Hot List
JC Parets Swing Trader Pro: Morning Briefing (03-09-2023) From the Desk of Kimmy Sokoloff If the market can hold on to yesterday's low, I think there's potential we can head higher. We really need to push past $SPY 400 with force and head straight to 405, then 408... March 9, 2023 Stocks Swing Trader Pro Newsletter
Steve Strazza The Short Report (03-08-2023) From the Desk of Steve Strazza @Sstrazza When investing in the stock market, we always want to approach it as "a market of stocks." Regardless of the environment, there are always stocks showing leadership and trending higher... March 8, 2023 All Star Charts Premium Premium Stocks ASC Strazza Grant Short Report Members Only
Patrick Dunuwila Daily Chart Report ? Wednesday, March 8th, 2023 March 8, 2023 The Chart Report Daily Chart Report Front Top Content Featured Stories
JC Parets Swing Trader Pro: Afternoon Briefing (03-08-2023) From the Desk of Kimmy Sokoloff Fed Chair Jerome Powell spoke again today, but the market could not get going to the upside. The semiconductors have been... March 8, 2023 Stocks Swing Trader Pro Newsletter
JC Parets [PLUS] Weekly Sentiment Report: Just Catching Their Breath From the Desk of Willie Delwiche Investors had second thoughts about stocks last week, with sentiment dropping... March 8, 2023 willie plus sentiment Sentiment Report
Patrick Dunuwila Chart of the Day - Wednesday, March 8th, 2023 March 8, 2023 The Chart Report Arun Chopra TCR Chart of the Day Nikkei 225 $EWJ Japan
Sean McLaughlin [Options] Materially Sideways? Today's trade is going to leverage the rising volatilities introduced into the stock market this week thanks to testimony from the Federal Reserve Chairman (I've been told). When markets get dicey and volatility rises, I like to look... March 8, 2023 All Options Options Premium ASC
Sean McLaughlin [Options P2P] New Position: XLU The next new position in our Paid-to-Play portfolio is: March 8, 2023 Options Paid to Play Paid To Play Members Only
JC Parets Buffett Is Back To Buy More OXY We’ve been looking out for this filing since last week! Right on time, Uncle Warren strikes again with the Berkshire put in Occidental Petroleum $OXY. March 8, 2023 Stocks Strazza The Hot List
JC Parets Swing Trader Pro: Morning Briefing (03-08-2023) From the Desk of Kimmy Sokoloff The market hit the breaks yesterday after Fed Chair Jerome Powell’s speech. Powell is to speak again today, which could make for sloppy trading. March 8, 2023 Stocks Swing Trader Pro Newsletter
JC Parets Inside Scoop Weekly Strategy Session - March 8, 2023 This is the video recording of the March 8, 2023, Inside Scoop Weekly Strategy Session. March 8, 2023 Hot Corner Insider Stocks Strazza Inside Scoop Inside Scoop Strategy Session Inside Scoop Strategy Session Members Only
Steve Strazza March Strategy Session: 3 Key Takeaways From the desk of Steve Strazza @Sstrazza We held our March Monthly Strategy Session on Monday night. Premium Members can access and rewatch it here. Non-... March 7, 2023 Stocks Intermarktet Analysis ASC Strazza Crypto
Ian Culley [Video] What the FICC?: US Dollar Index Rips Higher It's the weekly currency edition of What the FICC? Dollar and rates were big themes last year – rising in tandem – and continue to be as we head into March. It shouldn't come as a surprise as the next chart reveals the crux of the... March 7, 2023 Currencies youtube ASC Ian Currency Report Video
Ian Culley A Raging Dollar Revives Last Year’s Challenges From the Desk of Ian Culley @IanCulley What year is it? Is it 2023 or 2022? Because it’s starting to feel like last year all over again… No, Will Smith hasn’t slapped anyone (that I’m aware of). And I’m... March 7, 2023 All Star Charts Premium Currencies ASC Ian Currency Report Members Only
Patrick Dunuwila Daily Chart Report ? Tuesday, March 7th, 2023 March 7, 2023 The Chart Report Daily Chart Report Front Top Content Featured Stories
JC Parets Swing Trader Pro: Afternoon Briefing (03-07-2023) From the Desk of Kimmy Sokoloff That was a very volatile day, as we had Fed Chair Jerome Powell speaking. And he's speaking tomorrow too. March 7, 2023 Stocks Swing Trader Pro Newsletter
JC Parets [PLUS] Dynamic Portfolio Management From the desk of Willie Delwiche. Dynamic Portfolio Update: Our asset allocation models are tilting away from commodities, so we sold GLD in our cyclical portfolio (and replaced it... March 7, 2023 willie plus Dynamic Portfolio Management
JC Parets [PLUS] March Weight of the Evidence Dashboard: Rally Resilience Will Be Tested From the desk of Willie Delwiche. As good as the market looked in January, it looked that bad in... March 7, 2023 willie plus Weight of the Evidence
Patrick Dunuwila Chart of the Day - Tuesday, March 7th, 2023 March 7, 2023 The Chart Report $SPX S&P 500 Moving Averages TCR Chart of the Day Chris Ciovacco
Sean McLaughlin [Options P2P] New Position: EFA The next new position in our Paid-to-Play portfolio is: March 7, 2023 Options Paid to Play Paid To Play Members Only
JC Parets Know What Game To Play Last night was our Live Conference Call that... March 7, 2023 Stocks Internals ASC breadth
JC Parets Co-Founder DeFranco Is Buying DISH Shares The largest insider buy on today's list comes from DISH Network Corporation $DISH co-founder and executive vice-president, James DeFranco. DeFranco revealed a purchase of $15.7 million worth of DISH shares in his latest Form 4. March 7, 2023 Stocks Strazza The Hot List
Chart Request Live You Request It, We Break It Down. December 15, 2025 With special guest(s) Sam Gatlin Alfonso De Pablos, CMT
The Morning Show The King Of Seasonality December 15, 2025 Hosted by Spencer Israel JC Parets Steve Strazza With special guest(s) Kenny Glick Jeff Hirsch Sam Gatlin
The Morning Show It's Crypto Friday on The Morning Show December 12, 2025 Hosted by Spencer Israel JC Parets Steve Strazza With special guest(s) Kenny Glick Louis Sykes Larry Thompson


