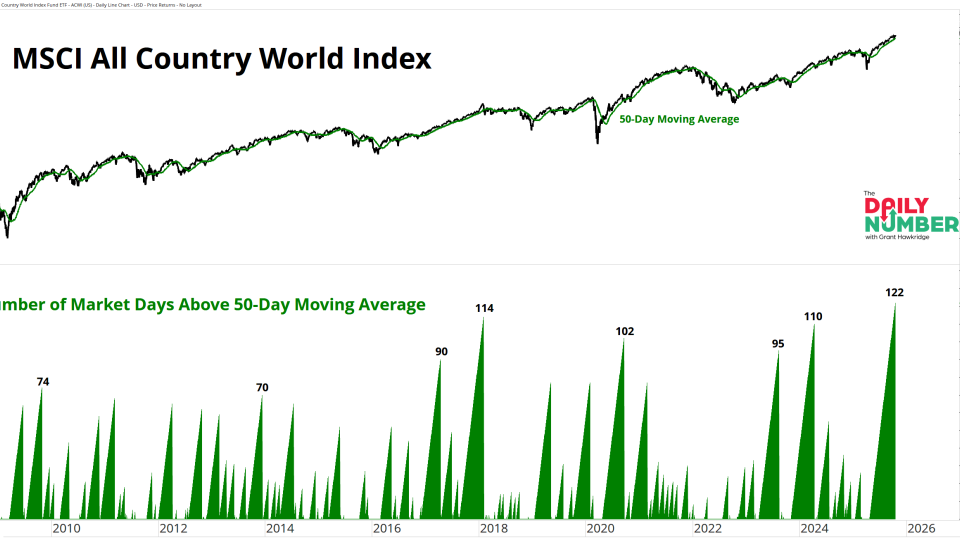
The MSCI All Country World Index has stayed above its 50-day moving average for 122 trading days. That’s the longest run of global strength in 15 years.
Every trader has their favorite tools — moving averages, Fibonacci, oscillators, you name it.But few are as powerful as the AVWAP.It’s the average price by volume anchored to a specific moment in time — blending price and psychology to show where the...
There were no S&P 500 earnings reactions on Monday, but we want to tell you about one of the hottest stocks in the world that you probably haven't heard of.
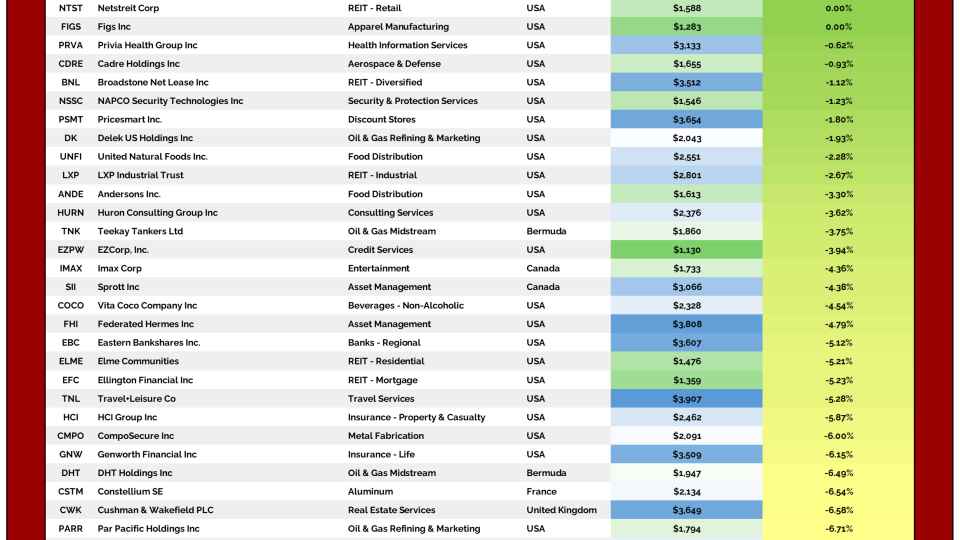
Every day, we sift through the filings to spot where the real conviction lies – cutting through the noise to highlight the most meaningful insider moves.
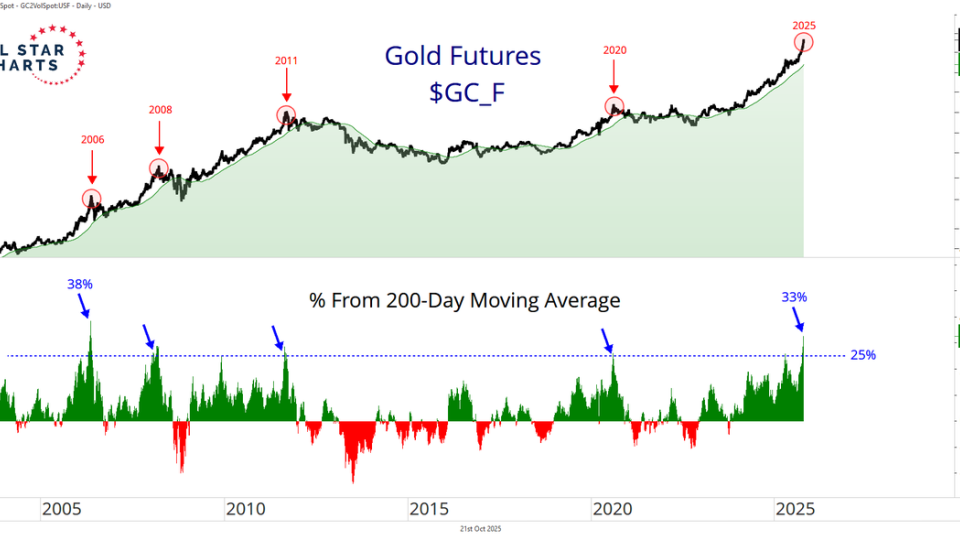
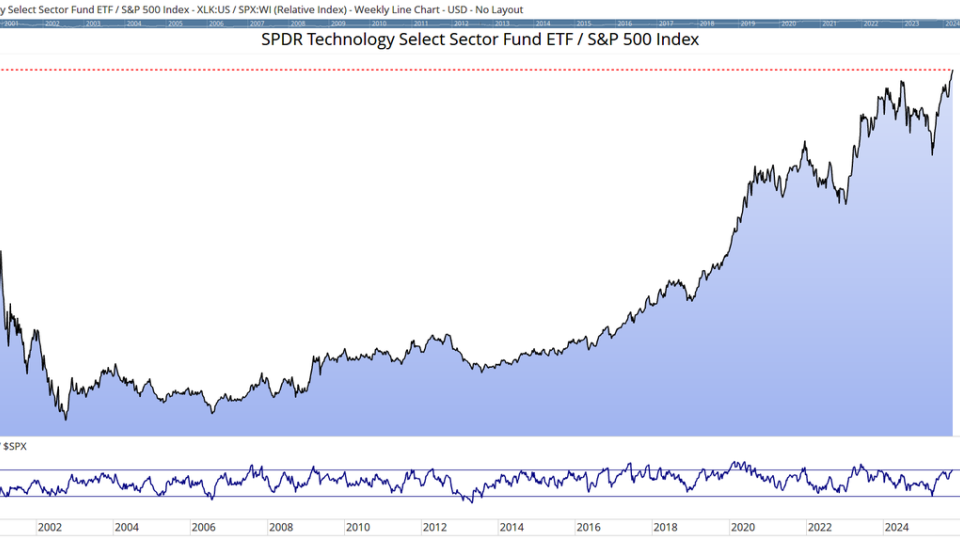
Most natural resource stocks, even the bellwethers of Metals or Energy, for example, can’t scale to $3 Trillion in market cap. They’re not those types of companies - they’re just not built like the...
When markets change, we have to be quick to adapt.
I'll be the first to admit I don't always adapt as quickly as I'd like. Of course, I only know this with the benefit of hindsight. It's incredibly hard to know in the moment when it's time to...