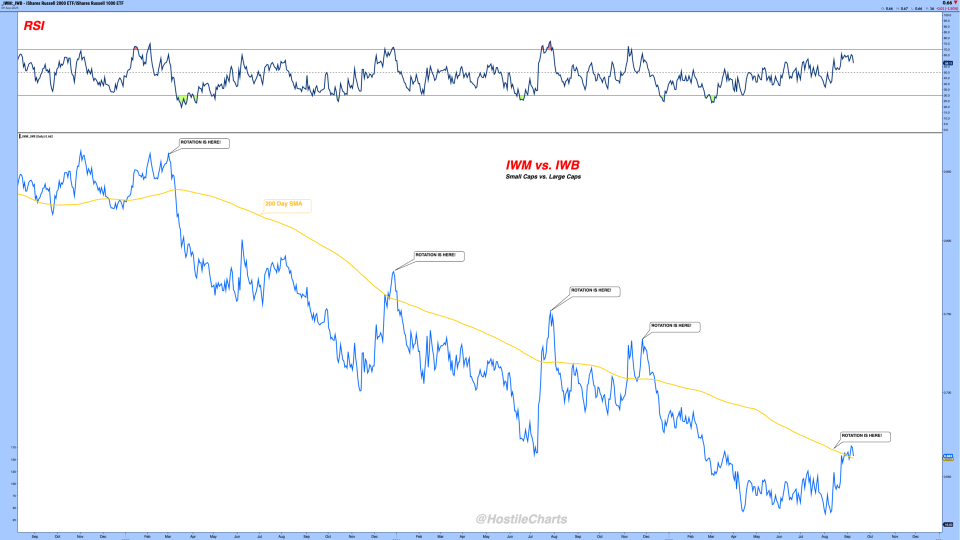
Micro Caps $IWC are spending another week at the top of our power rankings, while Small Caps $IWM have flipped back to green after months in the red.Zooming out, the base forming in the Russell 2000 index $IWM looks...
Every day, we sift through the filings to spot where the real conviction lies – cutting through the noise to highlight the most meaningful insider moves.
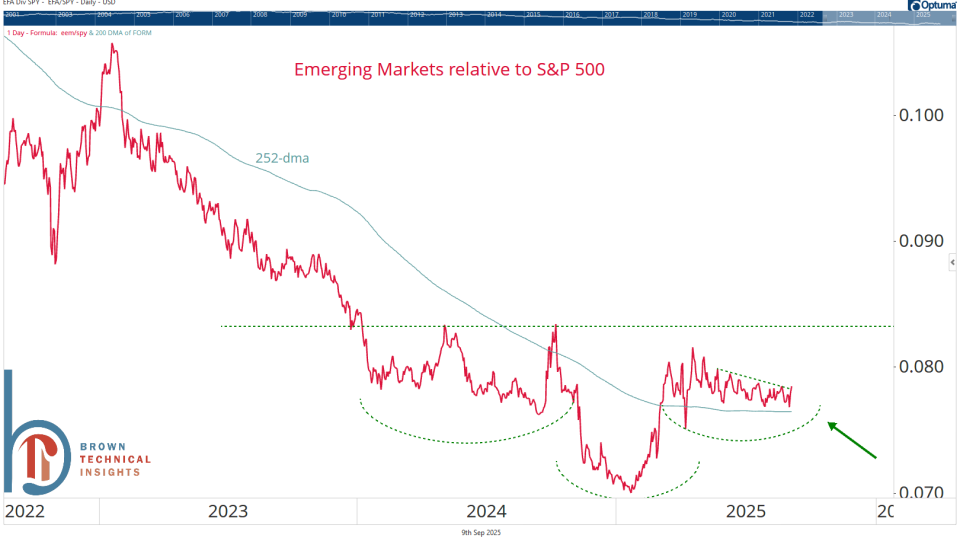
Markets outside the United States continue to show strength.Europe has been the clear beneficiary of this global rotation, but the latest wave of inflows is now reaching Latin America.Brazil—the region’s heavyweight—is...
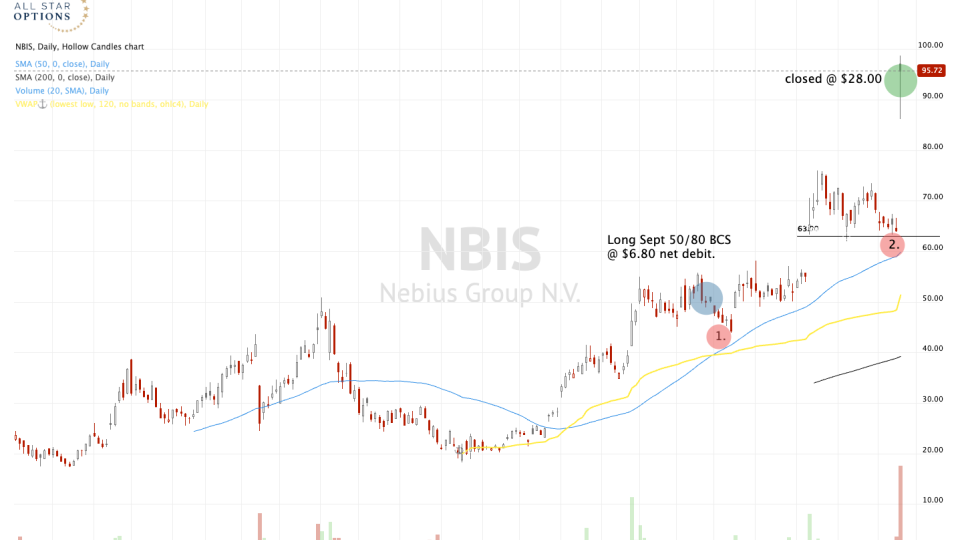
Picture this: You're holding long options that are so far underwater they might as well be fossils. The market has written them off. You've probably written them off too. They're the trading equivalent of being...