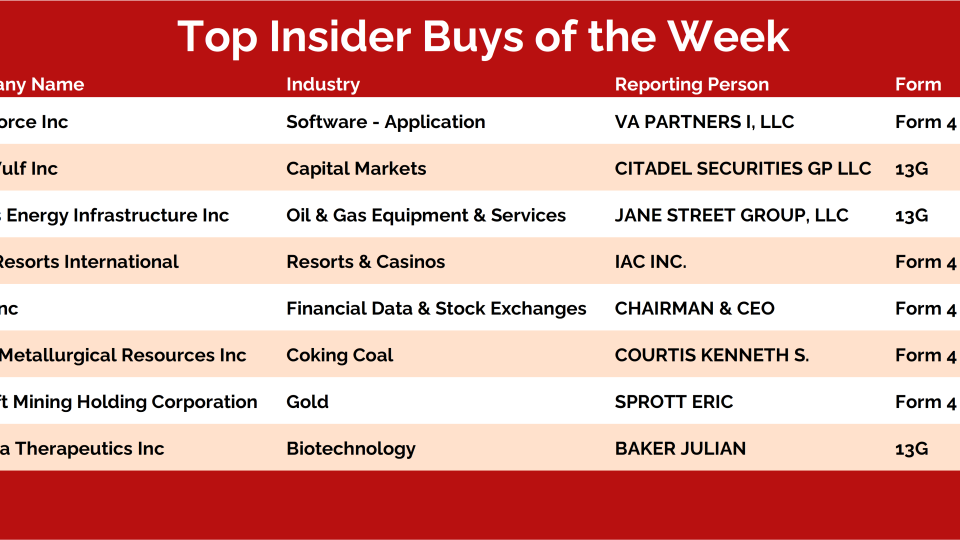
Every weekend, I dig into our insider activity tracker looking for the biggest conviction buys — and this week checked all the boxes: Baker Bros, coal stocks, big software bets, and precious metals.
We love our bottoms-up scans here at All Star Charts. We tend to get really creative when making new universes as we want to be sure they will deliver us the best opportunities the market has to...
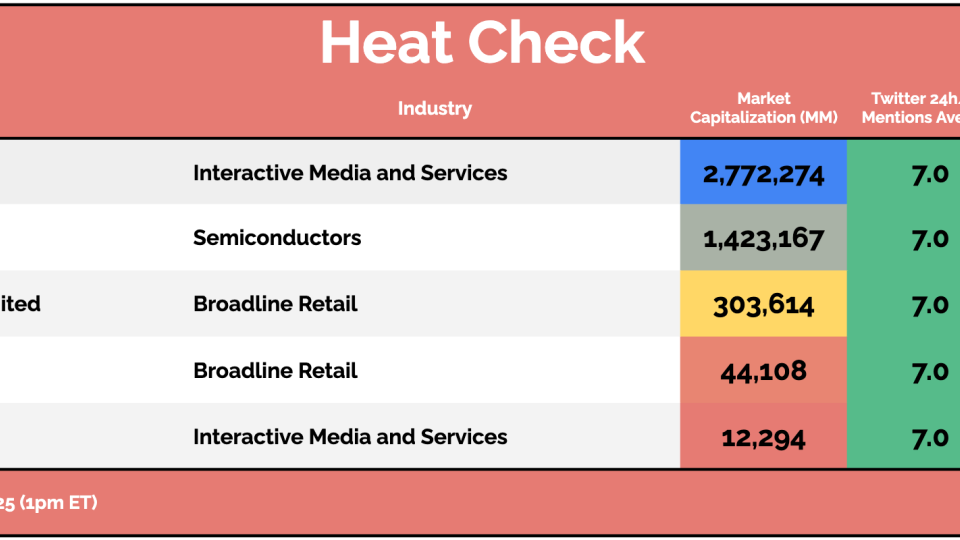
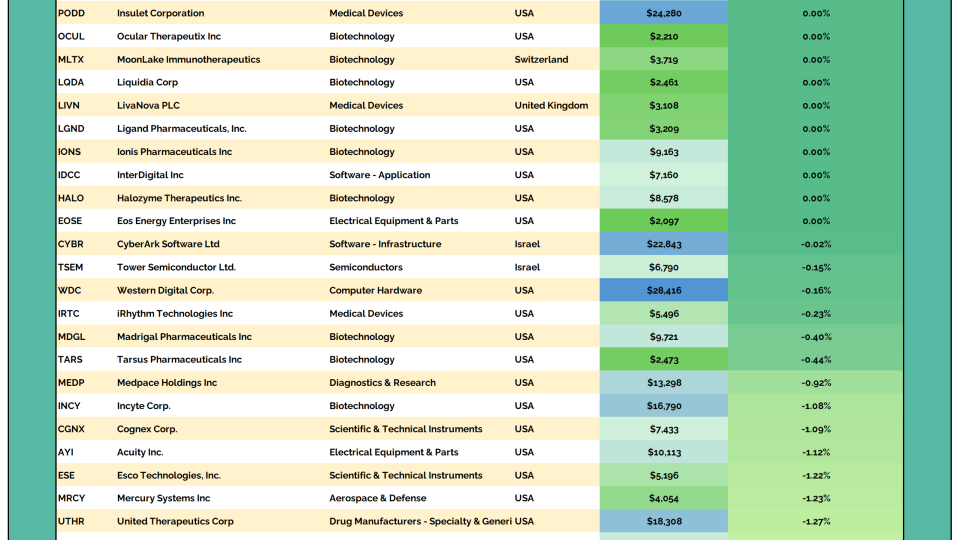
Every day, we sift through the filings to spot where the real conviction lies – cutting through the noise to highlight the most meaningful insider moves.
Earlier this week, we looked at the two tales of Asia: India breaking down while China breaks out.China’s market carries a much heavier tilt toward technology and growth than the rest of Asia or emerging markets more broadly...
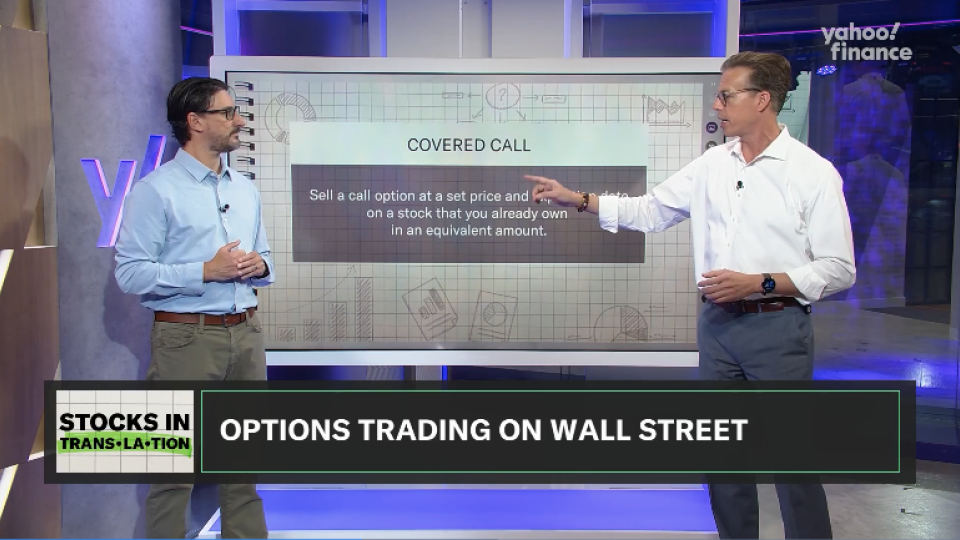
Last week in New York City, I had the privilege of joining my new friend Jared Blikre at the Yahoo Finance set to discuss a popular options strategy—the Covered Call.
Maybe I'm a skeptic, but sometimes I think of brokerages as dealers at the blackjack table.They are in business to get you to bring your money to their "platform." They aim to get you to feel comfortable, they teach you the rules of the game, they...
Every day, we sift through the filings to spot where the real conviction lies – cutting through the noise to highlight the most meaningful insider moves.
As stocks sold off yesterday, Energy $XLE and Healthcare $XLV were the only positive sectors.Zeroing in on Energy, it’s completing a breakout to new highs while most other groups are moving sideways.
I’ve always thought of cryptocurrencies like tech stocks: new technology with prices mostly moving with the Nasdaq.But yesterday was different.Stocks sold off. Gold popped. Bonds dropped. And Bitcoin? Up.That’s not noise. That’s a...
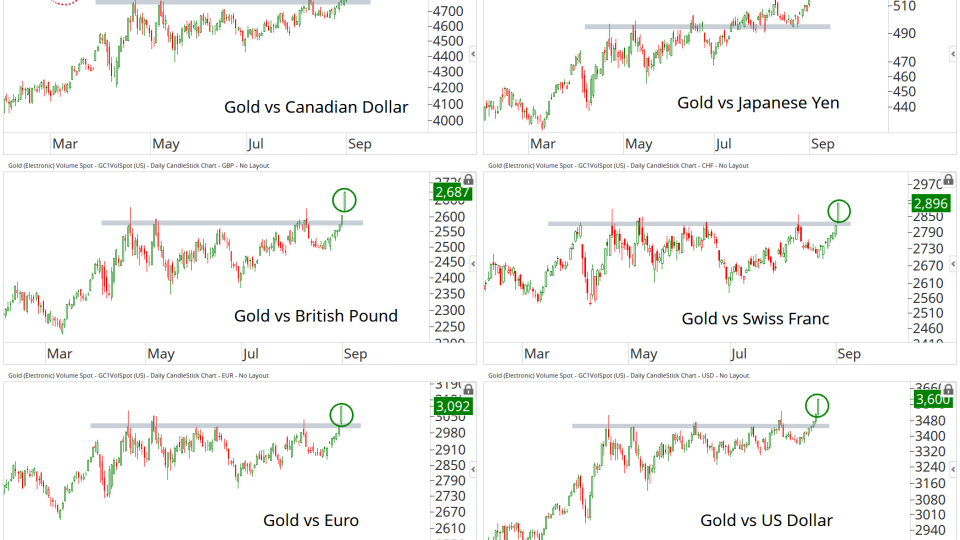
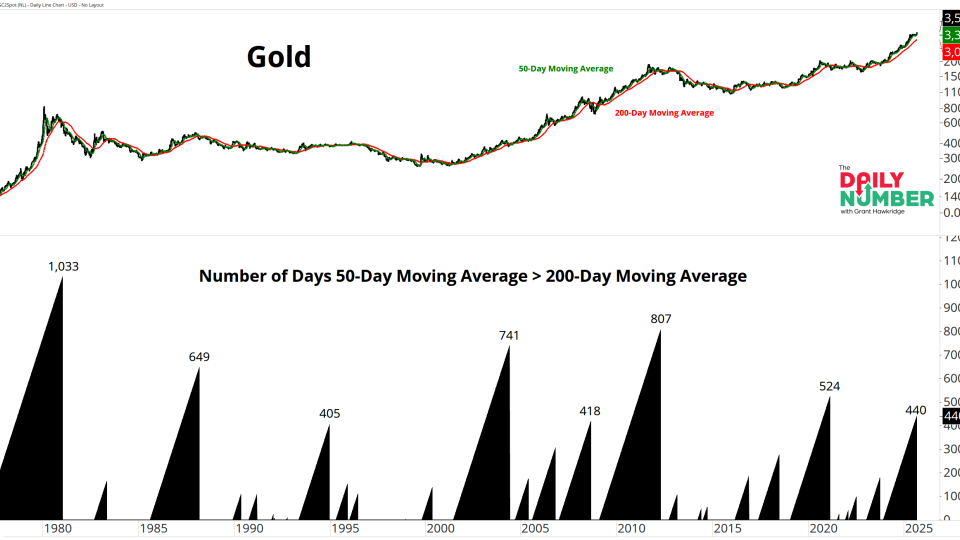
In this week’s Gold Rush video, we covered a lot of ground.
We discussed wild moves in Cattle futures, the energy complex, shifting global bond yields and their impact on the macro landscape, and Gold futures surging to...