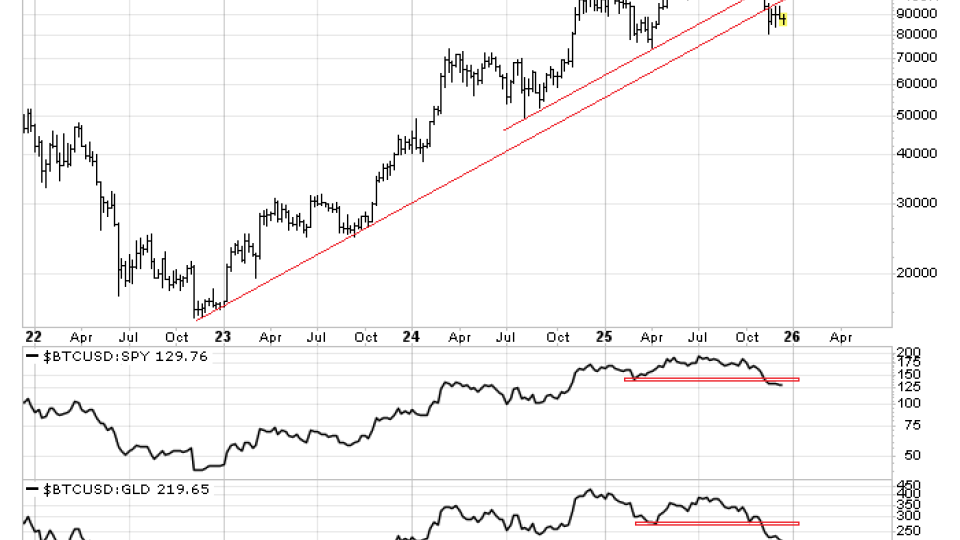
From the Desk of Steve Strazza @sstrazza and Alfonso Depablos @AlfCharts
This is one of our favorite bottom-up scans: Follow the Flow.
In this note, we simply create a universe of stocks that experienced the most unusual options activity — either bullish or bearish, but not both.
We utilize options experts, both internally and through our partnership with The TradeXchange. Then, we dig through the level 2 details and do all the work upfront for our clients.
Our goal is to isolate only those options market splashes that represent levered and high-conviction, directional bets.
We also weed out hedging activity and ensure there are no offsetting trades that either neutralize or cap the risk on these unusual options trades.
What remains is a list of stocks that large financial institutions are putting big money behind.
And they’re doing so for one reason only: because they think...
In this weekly note, we highlight 10 of the most important charts or themes we're currently seeing in asset classes around the world.
Bonds Lead
First bonds, then stocks, and now commodities have rolled over, following the traditional intermarket cycle. If the pattern holds, we should expect bonds to bottom first and eventually lead the way higher. With yields on the rise, there are no signs of this yet, but even a transition to a sideways trend could bring some stability to other asset classes.
US industry group trends are at a new low for the year and are approaching washed out levels. Take out the Energy groups and virtually nothing is in an up-trend.
The Details: The industry group trend indicator looks at 4 weekly trend metrics for each of the 72 industry groups in the S&P 1500 (24 each for small-caps, mid-caps and large-caps). The higher the number, the broader the strength at the industry group level.
More Context: From an industry group trend perspective, this is as bad as it got during COVID and during the bursting of the Tech Bubble. It was worse than this during the Financial Crisis (both during October 2008, which was not the low and March 2009, which was the low). We cannot know how bad it will get this time and so rather than anticipating a turn higher and improving conditions, I would rather wait for evidence of a turn and follow the trend higher.
We take a Deeper Look at what would give us confidence...
Check out this week's Momentum Report, our weekly summation of all the major indexes at a Macro, International, Sector, and Industry Group level.
By analyzing the short-term data in these reports, we get a more tactical view of the current state of markets. This information then helps us put near-term developments into the big-picture context and provides insights regarding the structural trends at play.
Let's jump right into it with some of the major takeaways from this week's report:
* ASC Plus Members can access the Momentum Report by clicking the link at the bottom of this post.
Macro Universe:
Our macro universe was negative this week as 77% of our list was lower for a median return of -1.07%.
Lumber $LB was the winner, closing with a 10.86% gain.
The biggest loser was Silver $SI, with a weekly loss of -10.78%.
There was a 3% gain in the percentage of assets on our list within 5% of their 52-week highs – currently at 9%.
Only 11% of our macro list made fresh 4-week highs.
In a busy morning for oil and gas deals, Continental Resources $CLR announced a merger agreement with the company founder and billionaire Harold Hamm.
Over the weekend, Hamm boosted his original offer from this summer to purchase the existing $4.3 billion worth of shares that he and his family do not already own for $74.28 per share.
There is a constant conversation among market participants about which indexes are the better representation of the stock market, particularly in the United States.
While the media often quotes the Dow Jones Industrial Average daily changes, professionals tend to steer towards the S&P500.
The argument normally revolves around the price-weighted nature of the Dow Jones Industrial Average vs the market-cap driven S&P500.
The diversity of 500 stocks in the S&P is also a key point when compared to just 30 stocks for the Dow.
Today, I just wanted to remind everyone why I think the Dow Jones Industrial Average is underrated and why I think it is still one of the most useful indexes for any stock market participant.
High Positive Correlation With The S&P500
First of all, the Dow Jones Industrial Average and the S&P500 have a very high positive correlation to one another.
In yesterday's note we talked about how the Dow Jones Industrial Average went up in price for the 2nd consecutive week. This isn't something we've seen happen too often in 2022.
But what else happened this week?
Well, we got fewer stocks making new 52-week lows on the NYSE. The peak in new lows was back in June, which was 4 months ago.
You can see it in shorter-time horizons as well. Look at the S&P500 new 63 day low list continuing to deteriorate (63 days = 3 months = 1 quarter):
These are the registration details for our live mid-month conference call for Premium Members of All Star Charts.
Our next Live Call will be held on Tuesday October 18th at 6PM ET. As always, if you cannot make the call live, the video and slides will be archived and published here along with every other live call since 2015.
From the Desk of Steve Strazza @Sstrazza and Alfonso Depablos @AlfCharts
Our International Hall of Famers list is composed of the 100 largest US-listed international stocks, or ADRs. We’ve also sprinkled in some of the largest ADRs from countries that did not make the market cap cut.
These stocks range from some well-known mega-cap multinationals such as Toyota Motor and Royal Dutch Shell to some large-cap global disruptors such as Sea Ltd and Shopify.
It’s got all the big names and more--but only those that are based outside the US. You can find all the largest US stocks on our original Hall of Famers list.
The beauty of these scans is really in their simplicity.
We take the largest names each week and then apply technical filters in a way that the strongest stocks with the most momentum rise to the top.
Based on the market environment, we can also flip the scan on its head and filter for weakness.
Let’s dive in and take a look at some of the most important stocks from around the world.