What are trade ideas?
Rangefinder trade ideas give a whole new dimension to your existing services. You can track ideas with real-time prices, and be alerted when to get in—or out—of a particular trade. No need to keep an eye on the market: we'll do it for you.
Viewing trade ideas in Rangefinder
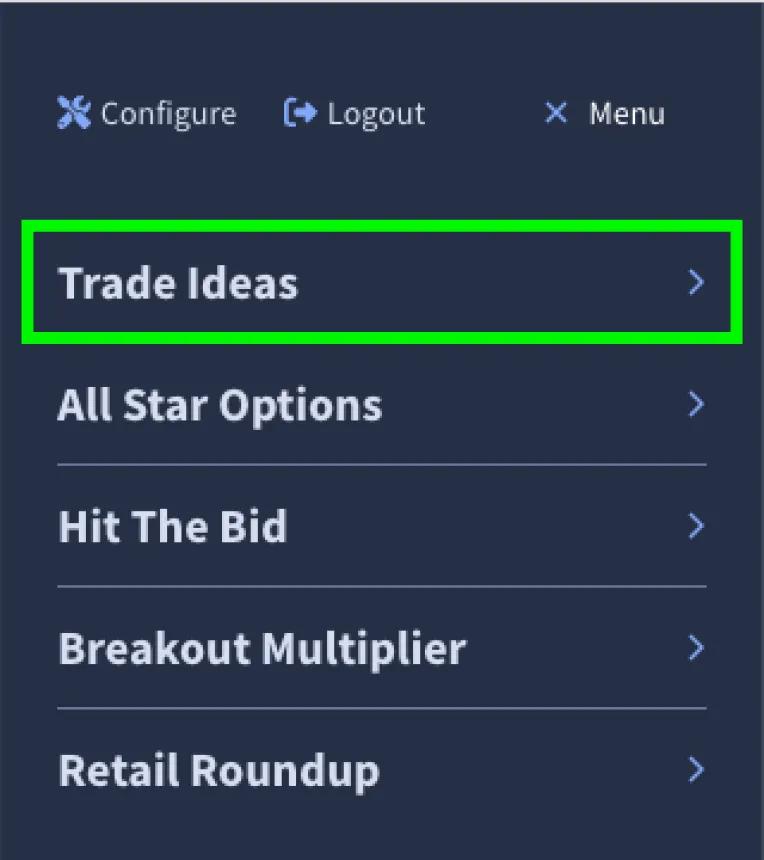
Whether you're subscribed to one service or multiple, you can find your equity and crypto trade ideas by opening the main menu and navigating to the "Trade Ideas" link.
Trade Idea Components (list display)
You can peruse equity trades in a list or grid format. The components from the list displays are below. See Detail Pages for other elements of an equity trade.
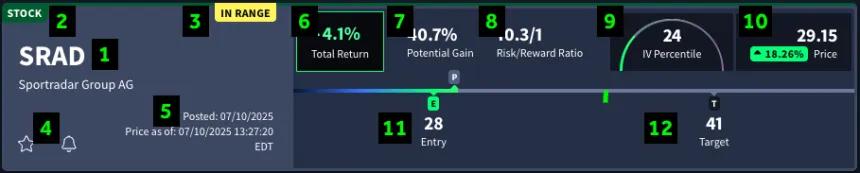
1 - Symbol
The symbol ticker and name for the trade idea.
2 - Asset Type
The asset type displays in the top left corner. Our current asset types for trade ideas include stock, crypto, ETF, and Forex.
3 - Price Status
A price status badge will display for a trade idea in the following scenarios:
- If the price is at/near the entry price
- If the price has reached its stop loss price
- If the price is between the entry and target price(s).
- If the price is at/near its target price(s).
4 - Favorite and Alert toggles
Use the favorite toggle (the star) to mark symbols you want to keep your eye on and filter the list by. Use the alert toggle (the bell) to turn on price alerts that you can get in the app or, if turned on, receive via push notification.
5 - Dates
Active trades will display the original post date for the trade idea and a real-time price timestamp for the current price. A closed trade will show the post date, entry date, and closing date.
6 - Total Return
Once a trade has reached its entry point, the total return for the trade will display, color coded for whether it is currently at positive or negative value.
7 - Potential Gain
The percentage of gain if the trade idea reaches its target, displayed on active trades.
8 - Risk/Reward Ratio
The odds of the risk of the trade idea.
9 - IV Percentile
The Relative Implied Volatility score for the symbol (if one exists).
10 - Current Price
The real-time price of the symbol, with its advance or decline percentage compared to the previous day's closing price There is a corresponding "P" notation on the price gauge to visualize the current price against the entry and target values.
11 - Entry Price
The entry/buy-in price for the trade idea. The gauge indicator will be green if the entry price has been reached.
12 - Target Price(s)
The target/sell price for the trade idea. There may be up to three targets per trade. The gauge indicator will be red if the target price has been reached.
13 - Stop Loss (not pictured)
The sell price for the trade idea to prevent further loss. The gauge indicator will be blue if the stop loss price has been reached, and the trade idea will close.