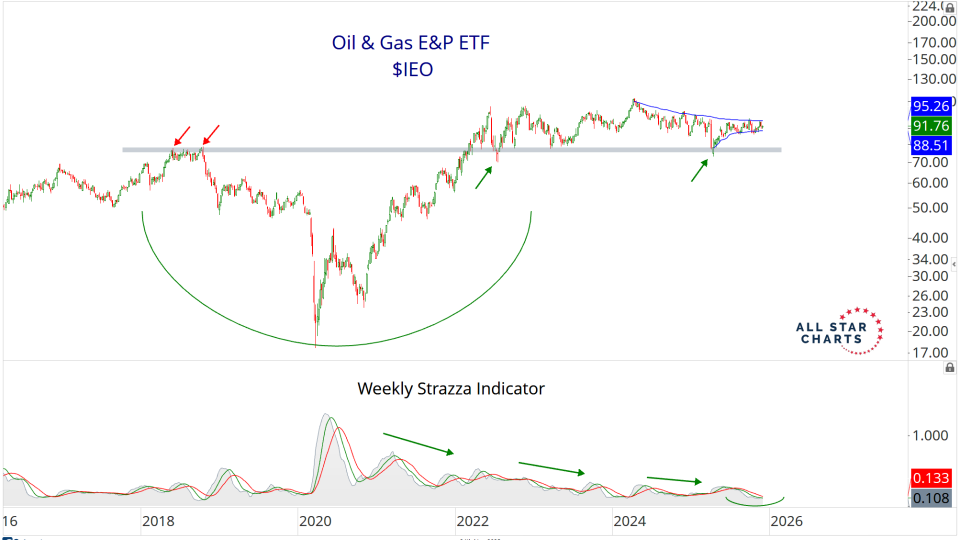
Our International Hall of Famers list is composed of the 100 largest US-listed international stocks, or ADRs.
We've also sprinkled in some of the largest ADRs from countries that did not make the market cap cut.
These stocks range from some well-known mega-cap multinationals such as Toyota Motor and Royal Dutch Shell to some large-cap global disruptors such as Sea Ltd and Shopify.
It's got all the big names and more–but only those that are based outside the US. You can find all the largest US stocks on our original Hall of Famers list.
The beauty of these scans is really in their simplicity.
We take the largest names each week and then apply technical filters in a way that the strongest stocks with the most momentum rise to the top.
Based on the market environment, we can also flip the scan on its head and filter for weakness.
Let's dive in and take a look at some of the most important stocks from around the world.
Insider activity was fairly quiet overall, but a significant buy at Nike Inc $NKE dwarves the day’s other transactions.
📌 The most notable insider activity from yesterday’s filings came from the boardroom of Nike $NKE, where Director Bob Swan disclosed a $502,756 purchase.
📌Chairman Mitchell Jacobson filed a Form 4 revealing a $11.1 million purchase in MSC Industrial Direct Co $MSM.
Here’s The Hot Corner, with data from April 9, 2025:
Click the table to enlarge it.
📌 Last but not least, NexPoint Residential Trust $NXRT CFO Paul Richards stepped in with a $193,275 open-market purchase—always a signal worth tracking when it comes from the chief financial officer.
The St. Louis Fed Financial Stress Index has risen above the zero line, increasing to 0.09.
Here’s the chart:
Let's break down what the chart shows:
The blue line represents the price of the S&P 500 index.
The green/redline represents the St. Louis Fed Financial Stress Index. When the line is green, it indicates that financial market stress is lower than normal. Conversely, when the line is red, it indicates that financial market stress is higher than normal.
The St. Louis Fed Financial Stress Index measures financial stress in markets and is published by the Federal Reserve Bank of St. Louis. This index is constructed from 18 weekly data series: seven interest rate series, six yield spreads, and five other indicators. Each of these components provides insights into different aspects of financial stress.
The Takeaway: Here is another data point for the bears…
The St. Louis Fed Financial Stress Index has reached its highest level of market stress...
We’re coming off extreme oversold levels with sentiment in washout territory.
A monster bounce is just around the corner.
So I’ve been digging through all of our scans over the last few days. Some new, some old. Looking for the best long opportunities.
They are all different and cover a variety of universes. International stocks, US growth stocks, sector and industry ETFs, commodity stocks, etc. We have something for everything.
The scans are all similar in a sense that they look to highlight some form of relative strength, momentum, or a combination of the two.
I'll be back from a nice family vacation later today and will be LIVE on The Morning Show Friday morning.
Miami is fantastic this time of year. I highly recommend a good vacation, if that's something that you can afford to do.
There was a time in my life that I couldn't afford this kind of thing, so it makes me appreciate it so much more. Many of you already understand this. Some of you will one day.
I wanted to check in and share a few things I've been thinking about while I've been away this week.
One thing that certainly stands out is just how great it is to stay off twitter while you're way with your family.
If you want to make sure you're a bad father, one way to solidify that is to spend all your time tweeting during family vacations.
I kid. But this is definitely a luxury that I couldn't understand in my younger days.
Insider activity was fairly quiet overall, but a significant buy at Nike Inc $NKE dwarves the day’s other transactions.
📌 The most notable insider activity from yesterday’s filings came from the boardroom of Nike $NKE, where Director Bob Swan disclosed a $502,756 purchase.
📌Chairman Mitchell Jacobson filed a Form 4 revealing a $11.1 million purchase in MSC Industrial Direct Co $MSM.
Here’s The Hot Corner, with data from April 9, 2025:
Click the table to enlarge it.
📌 Last but not least, NexPoint Residential Trust $NXRT CFO Paul Richards stepped in with a $193,275 open-market purchase—always a signal worth tracking when it comes from the chief financial officer.
The S&P 500 just recorded its third best day on record - it's best since 2008!
In these markets, correlations spike to 1. In other words, as everything crashes, everything is basically trading together. Even the ETFs on our thematic list, despite being very different, are trading very similarly.
Yesterday signaled that the worst is behind us in the very near term. But what remains to be seen is how this story will progress as the U.S. retaliates against China.
These aggressive moves are very typical for bear markets, and looking out longer-term the risk is certainly still elevated in owning equities.
Yesterday's daily move of +9.5% for the S&P 500 was its third-best day going all the way back to the 1950s.
Here’s the chart:
Let's break down what the chart shows:
The blue line in the top panel is the S&P 500 index price.
The green & red lines in the bottom panel is the daily percentage change.
The table showcases the forward returns for the top 20 best days for the S&P 500.
The Takeaway: If you have been following my daily notes this week, you would have seen on Monday that I noted that a massive back-to-back price drop could indicate that we had reached a market bottom. On...