Well, I'd like to hear from you to tell me how good.
I've spent the past few weeks reflecting on my own trading transformation in 2025—the wins, the lessons, the shifts in confidence and approach. But I'm...
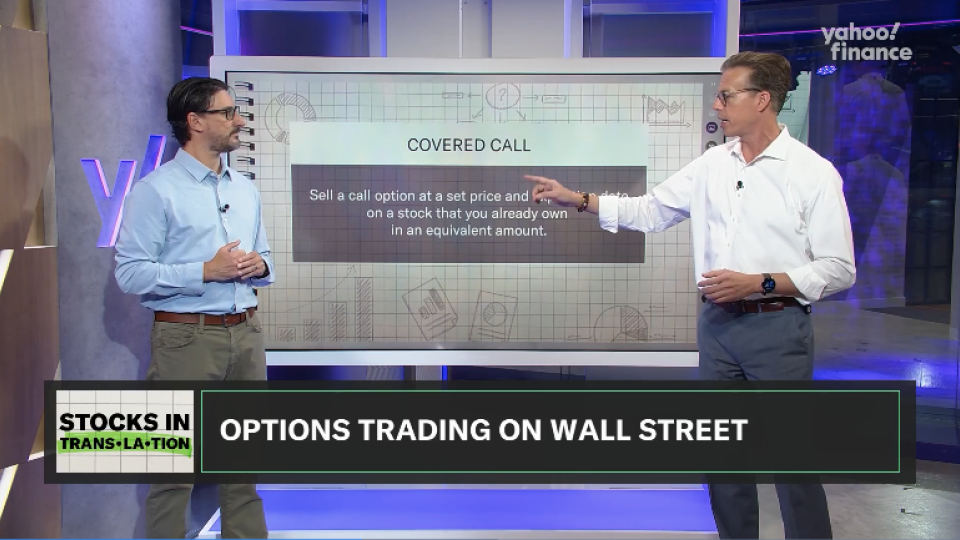
Last week in New York City, I had the privilege of joining my new friend Jared Blikre at the Yahoo Finance set to discuss a popular options strategy—the Covered Call.
Maybe I'm a skeptic, but sometimes I think of brokerages as dealers at the blackjack table.They are in business to get you to bring your money to their "platform." They aim to get you to feel comfortable, they teach you the rules of the game, they...
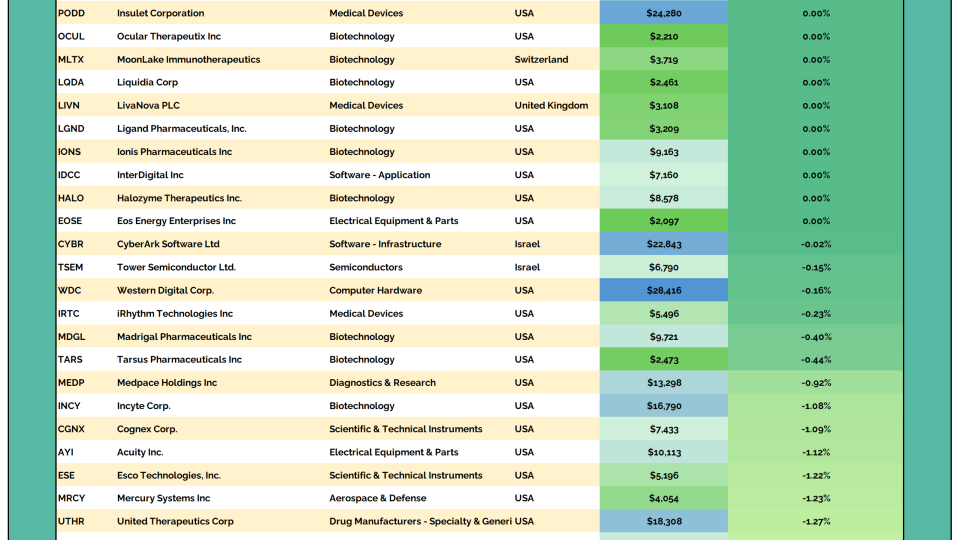
Every day, we sift through the filings to spot where the real conviction lies – cutting through the noise to highlight the most meaningful insider moves.
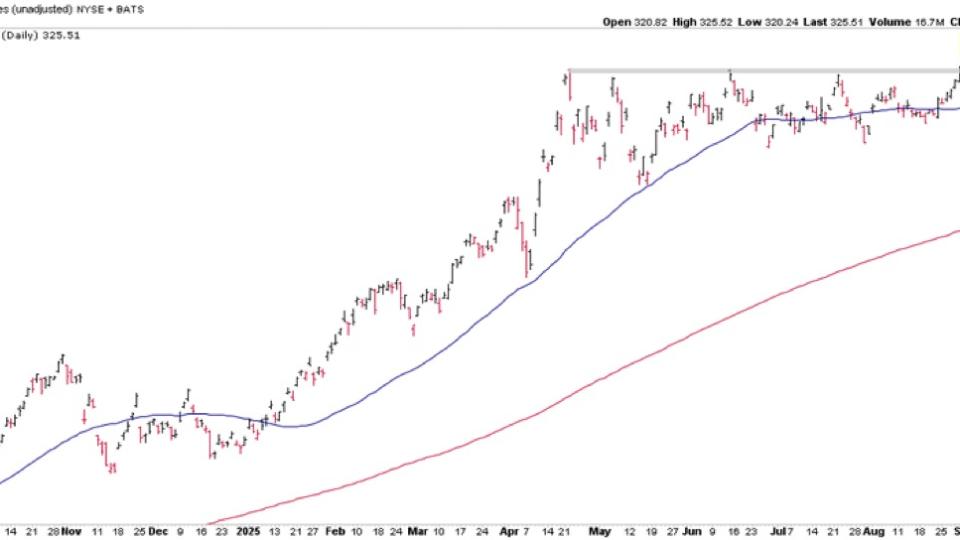
As stocks sold off yesterday, Energy $XLE and Healthcare $XLV were the only positive sectors.Zeroing in on Energy, it’s completing a breakout to new highs while most other groups are moving sideways.
I’ve always thought of cryptocurrencies like tech stocks: new technology with prices mostly moving with the Nasdaq.But yesterday was different.Stocks sold off. Gold popped. Bonds dropped. And Bitcoin? Up.That’s not noise. That’s a...
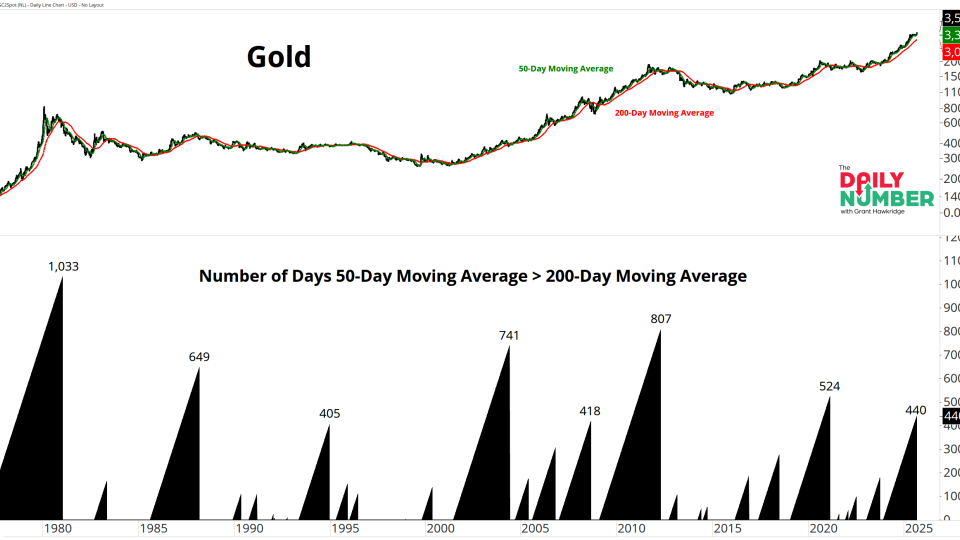
In this week’s Gold Rush video, we covered a lot of ground.
We discussed wild moves in Cattle futures, the energy complex, shifting global bond yields and their impact on the macro landscape, and Gold futures surging to...
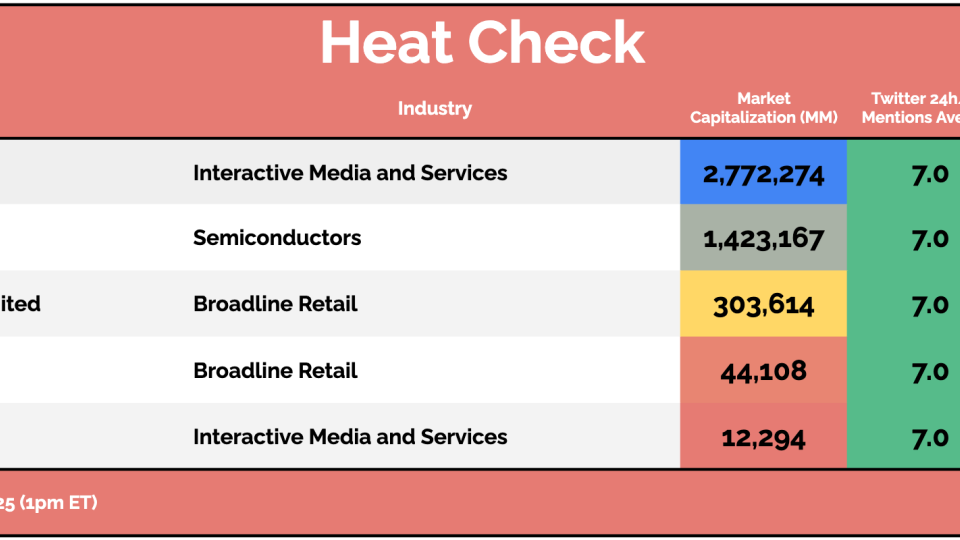
There weren't any S&P 500 earnings reactions on Monday because of Labor Day in the United States, but the gaming and esports industry has our attention.
This industry is undergoing a true renaissance. What was once seen as a niche corner of...
Clearly, it’s a surprise to see Micro Caps $IWC top the U.S. table given their long history of underperformance.It’s encouraging to see small and micro caps outperform over the past few weeks, it signals broadening...
Every day, we sift through the filings to spot where the real conviction lies – cutting through the noise to highlight the most meaningful insider moves.