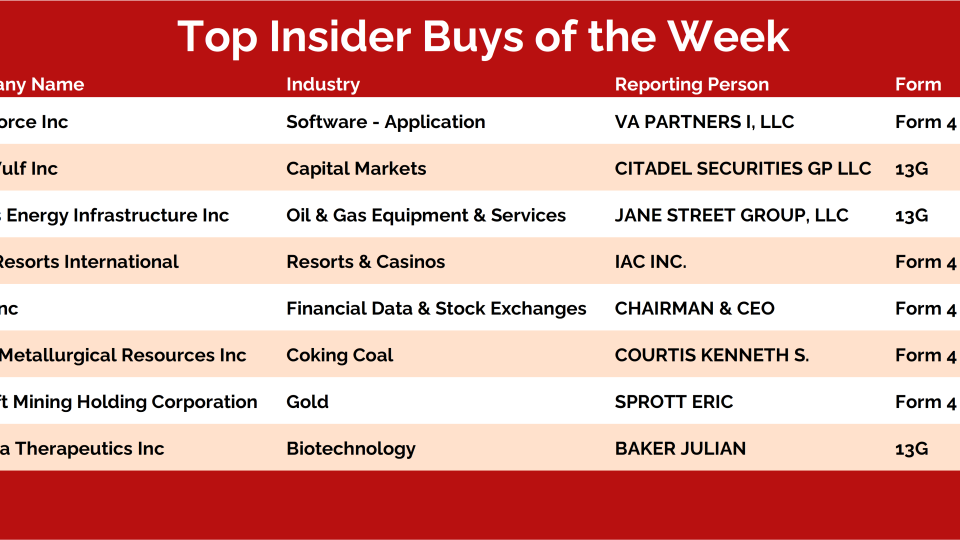
Bank of America's US High Yield Option-Adjusted Spread is currently at its lowest level in 17.5 years.
Here’s the chart:
(right-click and open image in new tab to zoom in)
Let's break down what it shows:
The black line is the BofA’s US High Yield Option-Adjusted Spread.
The red line is the 40-week moving average of the High Yield Spread.
The blue line is the S&P 500 index price.
The gray shading highlights when the high yield spread 40-week average is trending lower.
The Takeaway: Let me explain this data more clearly…
A widening in high-yield spreads (the black line moving higher) typically indicates a risk-off environment. This suggests that investors are becoming more risk-averse and that the economy may be facing challenges. Conversely, a tightening in high-yield spreads (the black line moving lower) indicates the opposite.
If there had been meaningful stress in the stock...
Consumer Discretionary $XLY and Financials $XLF are still the strongest sectors right now.
What's capturing our interest is the rebound we've seen in energy stocks, pictured below.
While this is certainly a positive development for the sector, we're still mindful that the Large Cap Energy ETF $XLE is still rangebound and isn't offering an actionable setup currently.
Jeff Macke's Favorite Retail Stocks Right Now
Jeff Macke has been analyzing retail stocks for more than 30 years. Now, for the first time, he's sharing his ideas in a live model portfolio and sharing his best ideas as part of the Retail Roundup. Learn more in this special live event.
It’s in make or break territory—either the dollar cracks here, just like it did after Trump’s last inauguration, or it holds strong and puts pressure on stocks, commodities and the global economy.
I’m betting the greenback is heading south, and if I’m right, it’ll be a game changer for risk on assets.
Remember what happened to Bitcoin the last time the dollar fell back in 2017?
Historically, a weakening dollar has fueled massive moves across commodities, currencies, cryptocurrencies, and real economy stocks.
This isn’t just a short term trend—it’s the kind of shift that can set the tone for the next major macro cycle.
The dollar’s next move holds the key to what’s ahead for global markets.
Thanks for reading.
And be sure to download this week’s Currency Report!
JC has really been bringing the heat with his chart game lately.
I just rewatched the monthly conference call from Monday night where he ripped through over 115 charts.
He went over a ton of valuable topics and themes, from forex to sentiment and even some risk appetite.You can sign up here and watch it. These calls are one of the best things we do at All Star Charts.
In the meantime, I stole two of my favorite charts from his slide deck to share with you.
Here’s the first one. This is a textbook topping formation in Eli Lilly $LLY with a peak marked by the old reliable magazine cover indicator from October of last year.
The timing from these headline writers is just too good sometimes. This is the millionth example. They nailed it again.
They call them the “everything drugs.” They are probably not, but let's just go with it. This excerpt is all you need to know about the vibe on the street for GLP-1 stocks.
In this scan, we look to identify the strongest growth stocks as they climb the market-cap ladder from small- to mid- to large- and, ultimately, to mega cap status (over $200B).
Once they graduate from small-cap to mid-cap status (over $2B), they come on our radar. Likewise, when they surpass the roughly $30B mark, they roll off our list.
But the scan doesn't just end there.
We only want to look at the strongest growth industries in the market, as that is typically where these potential 50-baggers come from.
Some of the best performers in recent decades – stocks like Priceline, Amazon, Netflix, Salesforce, and myriad others – would have been on this list at some point during their journey to becoming the market behemoths they are today.
When you look at the stocks in our table, you'll notice we're only focused on Technology and Growth industry groups such as Software, Semiconductors, Online...
Technology stocks have been quite the laggard for some time. In fact, the Large-cap Technology Index ($XLK) is actually down since mid-July.
Sector Rotation is the lifeblood of a bull market. How many times have you heard me say that?
And this cycle is no different. They used to tell me that it was only the Tech stocks that were driving this bull market, and nothing else what's working.
Here we are with the S&P500 hitting new all-time highs literally every single month, and Technology stocks are actually down since July.
The S&P 500 closed less than 1% from a new all-time high in the 1st market session under the new Trump administration.
It was a great day for the bulls.
In addition to the broad rally, investors dove into the latest financial results from massive corporations like Charles Schwab, DR Horton, and 3M.
Here are the latest earnings reactions from the S&P 500:
*click the image to enlarge it
Prologis $PLD, a leading industrial warehouse REIT, had the best earnings reaction and rallied over 7% with a reaction score of 3.43. PLD reported mixed top and bottom-line results, but the market did not care about that. It was all about the positive guidance for 2025.
The company is trying to grow its presence in the data center and energy industries, and the market is rewarding them for their efforts.
DR Horton $DHI, the largest homebuilder, beat its top and bottom-line expectations but fell over 2.50% with a reaction score of -2.29. This poor reaction was primarily due to the negative gross margin guidance for 2025.
The homebuilders have been in the penalty box as an industry group, and DHI hasn't been...
It's another week of green for large and growth factors, with the Large Cap Growth ETF $IWF at the top of the table.
Zooming out, the trend is still favoring large caps over small caps. This is shown below as a ratio. There's no signs this trend is shifting yet.
We're at an important inflection point with a new administration, which can mark key reversals across investment themes.
For a deeper look at our thoughts about the new Trump administration and how it could impact markets, watch our Inauguration Day Special livestream replay by clicking here.
Relative to the benchmark in crypto (Bitcoin), Ethereum has trended straight down for the last two and a half years.
If the ETHBTC ratio was a chart of a company's stock versus the S&P 500, shareholders would question the CEO's ability to deliver value.
And I think this trend of Ethereum underperforming continues.
UNLESS, the Ethereum / Solana ratio can get back above these lows.
Thinking out loud, you know what would be absolutely hilarious?
If this was in the fact the bottom.
Just like how energy bottomed and commodities finally began outperforming stocks when Crude went negative, imagine if this trend of Solana outperformance ended on the President launching a Solana memecoin.
Honestly, it makes sense symbolically.
I just need to see this trend reverse. And in order for that to happen, the ETHSOL ratio needs to reclaim these lows.
And until it does, I think there are better opportunities in crypto outside Ethereum.
But it’s not just crypto where opportunities are appearing. Retail stocks are catching my attention, and there’s no one better to break it all down than JC...
Infrastructure companies play a key role in supporting the global economy and are at the forefront of some serious mega trends.
These companies literally build and service our everyday lives.
After 17 years of no progress, the iShares Global Infrastructure ETF $IGF is now challenging its pre-financial crisis highs as buyers work to complete a massive base.
This ETF holds a well-diversified basket of stocks, offering exposure across three primary sectors: utilities (40.4%), industrials—including transportation (38.6%), and energy (21%).
If IGF can break above its former highs around $52, the path of least resistance points higher, paving the way for a fresh leg up in these groups of stocks.
Rep. Nancy Pelosi, no stranger to headline-grabbing stock moves, is back in the spotlight with her latest Periodic Transaction Report—and it’s a big one.
The former Speaker of the House is making bold plays in some of the hottest sectors, doubling down on AI, and other growth trends, while dumping shares in Apple.
Here’s an update of her filing from Friday:
Pelosi recently sold 31,600 shares of Apple $AAPL, with a transaction value of roughly $8 million.
While she has been bullish on Apple in the past, this marks a notable reduction in her exposure. We know that she acquired about half the shares she just sold via call options back in May 2022. She made more than 80% on them.
So, Nancy is bearish Apple. But, we don’t follow her for her insider sales, we follow the Pelosi portfolio because it has been early to some of the best trends in growth investing. The Pelosi’s were early to NVDA. She has...
In today's Flow Show, Steve Strazza and I discuss what feels like the birth of a new leg higher for this ongoing, but recently struggling bull market.
And while I was lamenting the performance of $AAPL lately, Steve showed me the mirror opposite: $AMZN.
Watch this video to see how we arrived at today's trade, and see the details below:
Here's the Play:
I like buying an $AMZN June 250/300 Bull Call Spread for an approximately $9.65 net debit. This means I'll buy the June 250 calls and sell an equal amount of the 300 calls. And this debit I pay today represents the most I can lose if I'm dead wrong:
Amazon has earnings coming up on Thursday, February 6th. I'm mindful of this, in fact, I think it could be the catalyst that shoots this stock higher. But if I'm wrong, my risks are defined to the debit I paid.
For risk management purposes, I'll exit this spread if either one of the following conditions is met:
$AMZN sees a closing price below $215 at any time during my hold. Or,