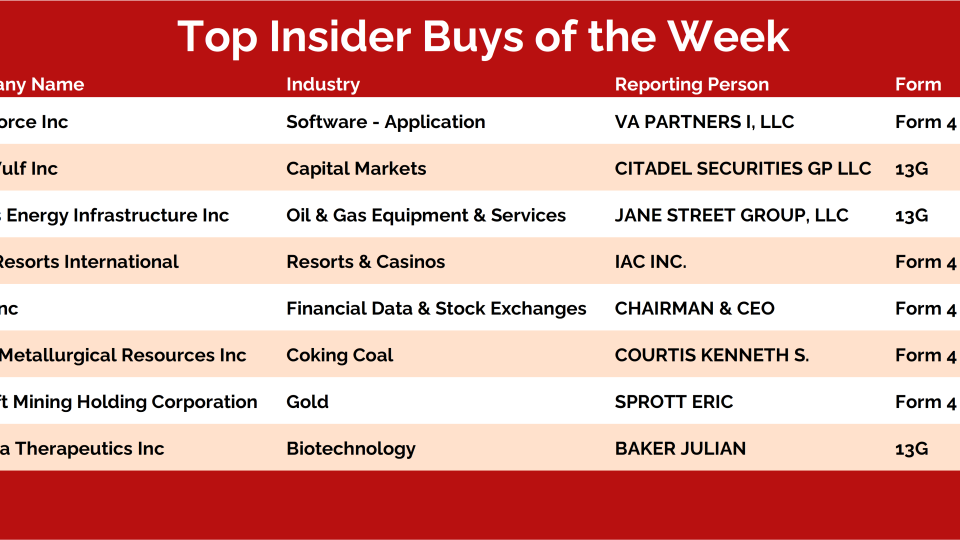
We had a discussion in the All Star Options chatroom yesterday about differences of opinion that got my mind spinning in a very positive way.
Sometimes, we traders might get a little offended when we've done the work to come up with a trade idea and share it with others -- then someone else offers a hot take on why the originator of the idea might be wrong. For some of us, we get momentarily annoyed, then we forget it and move on. For others, the "new information" causes us to abandon our trade thesis all together, sending us back to the drawing board in a state of frustration.
In the worst case, the originator of the idea gets offended, defensive, and perhaps even verbally abusive. And then both sides engage that way and nothing good comes from it.
I'd argue my best response is to meet the counter-intelligence as an opportunity to dig deeper to see if perhaps I missed something? If I find that I have, great! I'm better for it. If not, then I'll just end up feeling better about my opinion.
But the real meta thought here is this: WE WANT PEOPLE TO DISAGREE WITH OUR IDEAS.
We're in the 3rd year of a bull market and sector rotation continues to be a dominant theme that's driving stock prices higher, and probably more importantly, not allowing them to go lower.
Also during corrections, you regularly see rotation into the more defensive stocks, like Consumer Staples. You don't have that either. In fact, Consumer Staples just closed at new all-time lows relative to the S&P500.
While some sectors and industry groups have been taking a breather, after these historic runs, other stocks have been catching a bid - things like Medical Equipment, Airlines and now Energy stocks.
The one constant, however, is the rotation OUT of Consumer Staples.
This defensive sector consistently outperforms when stocks are under pressure, and when it's a less than ideal environment to be putting risk on in equities.
This is the opposite of that.
Look at the new all-time lows for Consumer Staples relative to the S&P500:
And while Consumer Staples tend to underperform in healthy environments, it's the Consumer Discretionary stocks that outperform the broader markets during the good...
The average 52-week drawdown of S&P 500 stocks has reached -18.2%. This means the average stock is experiencing its sharpest decline in over a year.
This kind of internal weakness begs the question of whether this is just a standard corrective wave within an ongoing bull market? Or are we witnessing the start of something more consequential, and even deeper drawdowns are ahead?
While there’s no need for alarm just yet, it’s crucial to stay mindful of how market participation is shifting.
This chart, hands down, is one of my all time favorites. It tells the entire story.
Bond yields hit their first long term cycle bottom in the 1940s. Then we had the stagflation of the ’70s, followed by the blow off top in 1982. From there, a nearly 40 year downtrend in yields that ended in 2020.
After that, yields have been grinding higher.
Now, if there’s ever going to be a year where bond yields take a breather, it’s probably this one.
But here’s the thing. In an environment where inflation refuses to back off, any dips in yields are likely to be short lived.
And let me make this crystal clear… just like I’ve been saying for the last five years: Long bond yields are going to have a hard time breaking lower.
And as always, be sure to download this week’s Bond Report
Our Hall of Famers list is composed of the 150 largest US-based stocks.
These stocks range from the mega-cap growth behemoths like Apple and Microsoft – with market caps in excess of $2T – to some of the new-age large-cap disruptors such as Moderna, Square, and Snap.
It has all the big names and more.
It doesn’t include ADRs or any stock not domiciled in the US. But don’t worry; we developed a separate universe for that. Click here to check it out.
The Hall of Famers is simple.
We take our list of 150 names and then apply our technical filters so the strongest stocks with the most momentum rise to the top.
Let’s dive right in and check out what these big boys are up to.
Here’s this week’s list:
*Click table to enlarge view
We filter out any laggards that are down -5% or more relative to the S&P 500 over the trailing month.
The First Five Days indicator for 2025 showed a positive return of 0.64%.
Here’s the table:
Here’s a bonus table highlighting all the positive years:
The Takeaway: Since 1950, this indicator has been positive 48 times. When it is positive, it has an average yearly gain of 15.6%, which is above the average yearly return of the S&P 500. Of the 48 years with a positive First Five Days, 83% have concluded the year on a positive note.
Not bad if you ask me.
But next on the list from Stock Trader's Almanac is the January Barometer (January Percentage Change), which is considered the most important of the January Trifecta (Santa Claus Rally, First Five Days & January Barometer) and I can confirm that if the January Barometer is positive, it returns on average a massive 18.1% yearly gain. Of...
Last week we discussed how Retail $XRT is transitioning from red to green and this bullish development is still intact.
With the Retail ETF $XRT retesting this level of support, it would be a logical place for buyers to step back in.
The next few weeks are the most critical time of year for investors in retail and consumer stocks, as companies report their results from the 2024 holiday season and set expectations for 2025.
Find out which retail stocks are best positioned right now in this free report from long-time retail analyst Jeff Macke.
Take a look at Large Cap Technology $XLK—it’s made a bold move, flipping from red to green as it chews through that overhead supply at former resistance.
The tape’s telling us the breakout might take its sweet time, but when it happens, expect tech to light up in full-on green mode.
To become better investors and traders, it’s natural for our minds to gravitate toward the mechanics of investing. We reach for the best research, systems, chart patterns, risk management strategies, and indicators—the list is endless.
And rightly so. These elements form the backbone of trading. I provide research every day with the intention of offering a valuable filter to help people focus on the most critical aspects of trading and ignore the noise.
But as essential as these tools and strategies are, there’s something even more fundamental—a foundation beneath the foundation.
Well-being.
This might not come as a revelation, given the growing cultural recognition of self-care, but consider this post a gentle reminder to pause and check in with yourself.
Are you attending to the things in your life that truly require your attention
Are you getting enough sleep?
Are your dietary habits supporting your energy and focus?
Are you moving your body regularly, even if just a little each day?
Are you nurturing meaningful relationships or spending time in way that recharge you?
We love our bottoms-up scans here at All Star Charts. We tend to get really creative when making new universes as we want to be sure they will deliver us the best opportunities the market has to offer.
However, when it comes to this one, it couldn't be any simpler!
With the goal of finding more bullish setups, we have decided to expand one of our favorite scans and broaden our regular coverage of the largest US stocks.
Welcome to TheJunior Hall of Famers.
This scan is composed of the next 150 largest stocks by market cap, those that come after the top 150 and are thus covered by the Hall of Famers universe. Many of these names will someday graduate and join our original Hall Of Famers list. The idea here is to catch these big trends as early on as possible.
There is no need to overcomplicate things. Market cap is a quality filter at the end of the day. It only grows if price is rising. That's good enough for us.
While the uptrends in the major indexes are holding up well, it's been a tale of mixed signals beneath the surface.
Some sectors and groups are showing strength, while others continue to lag behind.
Banks, for that matter, are an important piece of the puzzle. They are the backbone of the financial sector. They are some of the most important businesses for the US and global economy.
How bank stocks perform gives us a good read on where the broader market is headed.
The SPDR S&P Banks ETF $KBE took a shot at breaking out of this monster base following November’s election. This marks the second attempt at reclaiming its pre-GFC highs in the past few years.
Here's the recording and the chartbook from the second Breakout Multiplier Mastermind class, where we break down our tactical options strategy based on momentum.