Well, I'd like to hear from you to tell me how good.
I've spent the past few weeks reflecting on my own trading transformation in 2025—the wins, the lessons, the shifts in confidence and approach. But I'm...
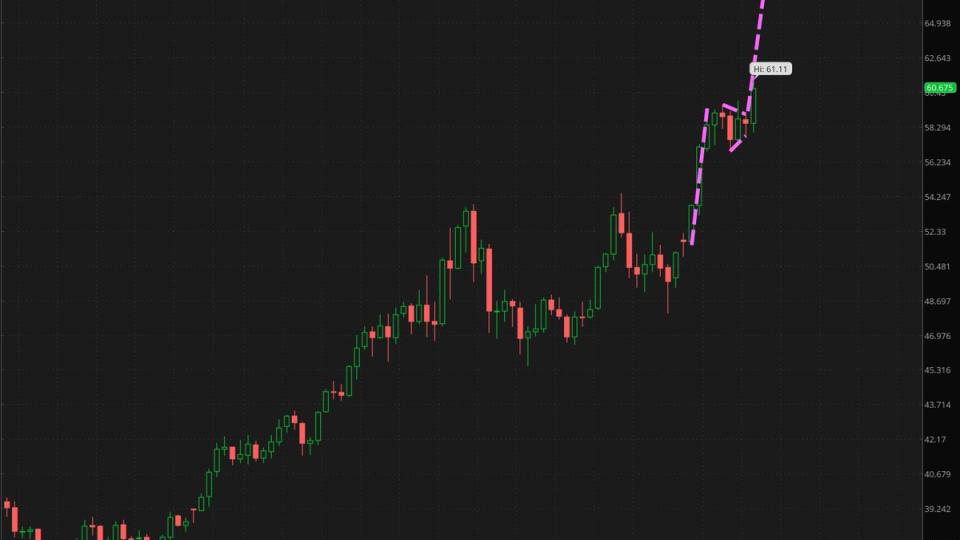
There were no S&P 500 earnings reactions on Wednesday, but we saw one of the strongest earnings reactions of the season in a name you've probably never heard of.
Photronics $PLAB isn’t a name most investors think of when discussing...
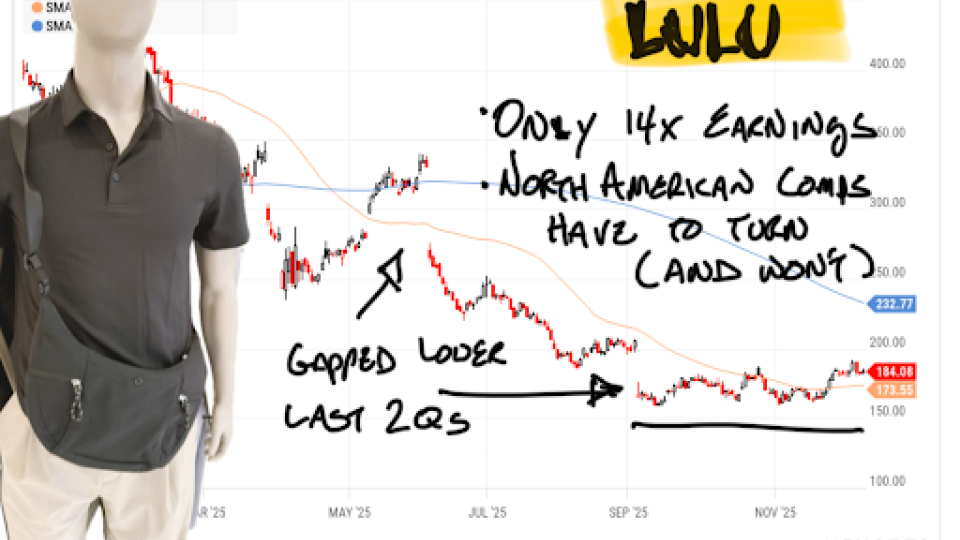
Once a week, I get together with Sean McLaughlin from All Star Options, and we're going to find an options trade to hunt for a new options trade for my Portfolio+ members. The goal is simple: utilize my expertise on the consumer and Sean's...
A massive add at MGM and a rare, high-conviction buy at MSCI
Every day, we sift through the filings to spot where the real conviction lies – cutting through the noise to highlight the most meaningful insider moves.
📌 MGM Resorts $MGM — IAC Inc. disclosed a $39.88...
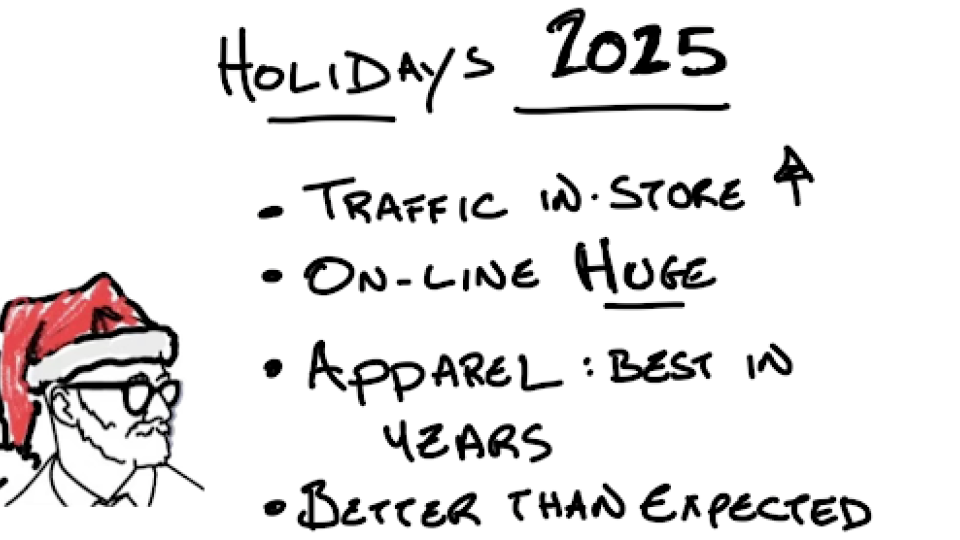
Welcome to my Boots On The Ground meeting. This is something I'll be doing every month for Macke Portfolio members. The intention here is to spend a few minutes talking about a specific topic that's been on my mind. Sometimes, it'll...