Every weekend, I dig into our insider activity tracker looking for the biggest conviction buys — and this week, we’ve got notable activity across metals, crypto, construction, and insurance.
Earnings are the heartbeat of the market - and every week brings a fresh set of opportunities and risks. With each report, we get new information about corporate health, investor sentiment, and the sectors driving leadership (or lagging).
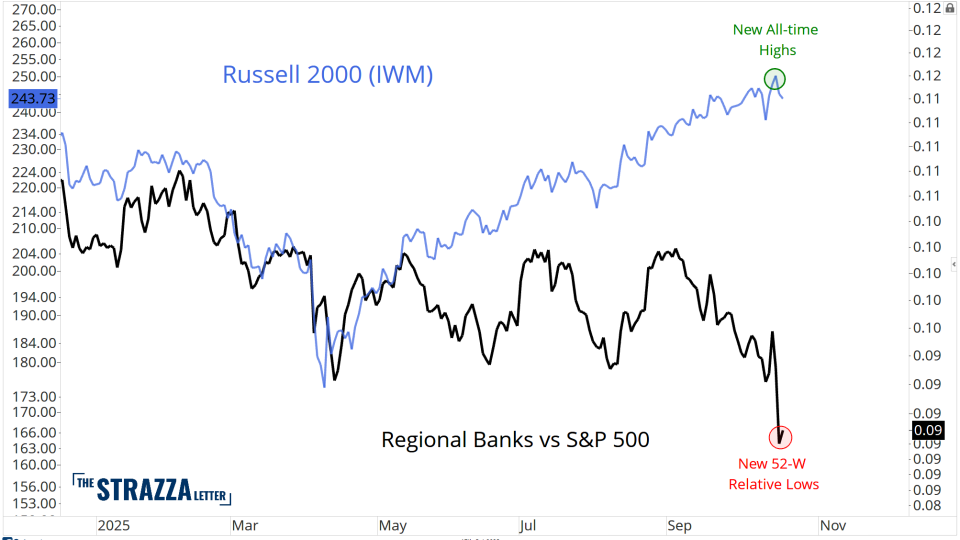
The Russell 2000 $IWM and Micro-Cap Index $IWC both printed new all-time highs earlier this week. That’s a milestone that, at first glance, speaks to growing risk appetite and broadening market strength.
We got Tariff'ed! Brutal couple weeks for the Portfolio+ after the POTUS announces (then semi-unannounces) 130% Chinese tariffs. In this week's edition I discuss taking profits on Williams-Sonoma, the huge quarter turned in by $ESLOY and why...
Every day, we sift through the filings to spot where the real conviction lies – cutting through the noise to highlight the most meaningful insider moves.