Well, I'd like to hear from you to tell me how good.
I've spent the past few weeks reflecting on my own trading transformation in 2025—the wins, the lessons, the shifts in confidence and approach. But I'm...
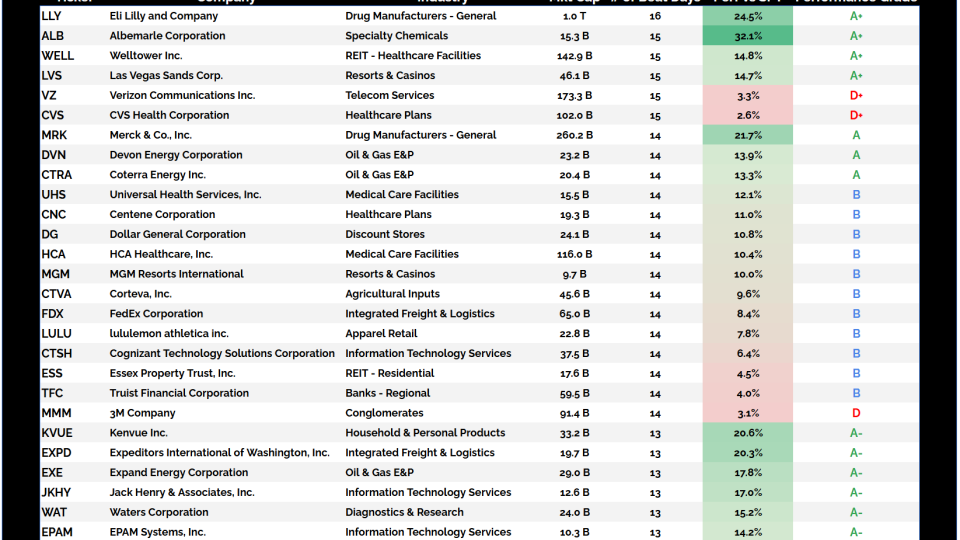
Every day, we sift through the filings to spot where the real conviction lies – cutting through the noise to highlight the most meaningful insider moves.
📌 Grindr $GRND — Director George Raymond Zage III...
This morning, I exited an iron condor trade in $IBIT, the Bitcoin ETF.
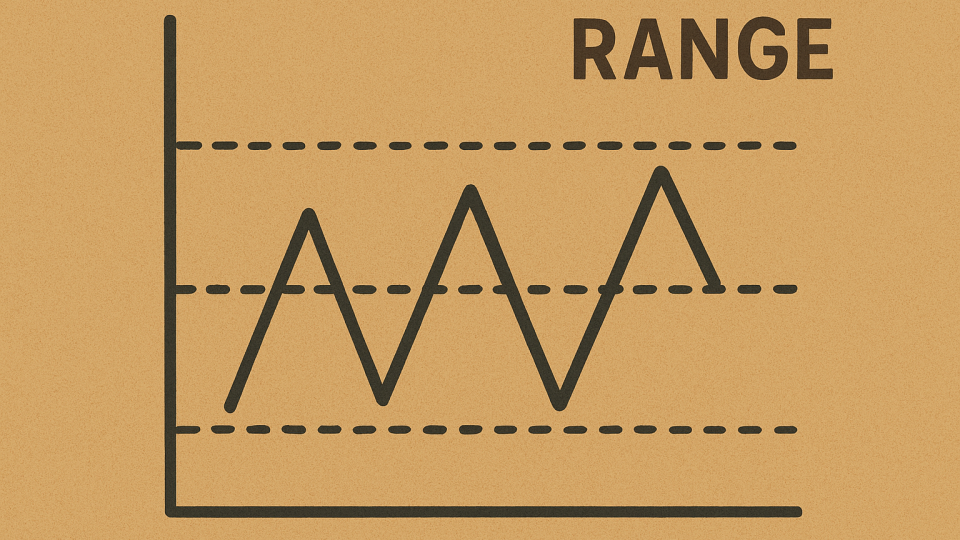
For those unfamiliar, an iron condor is a delta-neutral options strategy that profits when the underlying stays within a defined range. It consists of four options: selling...
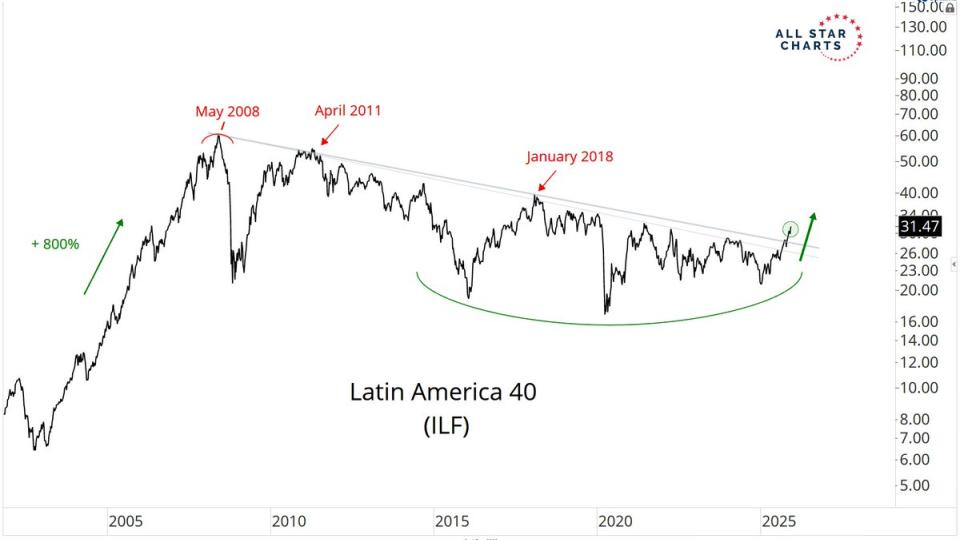
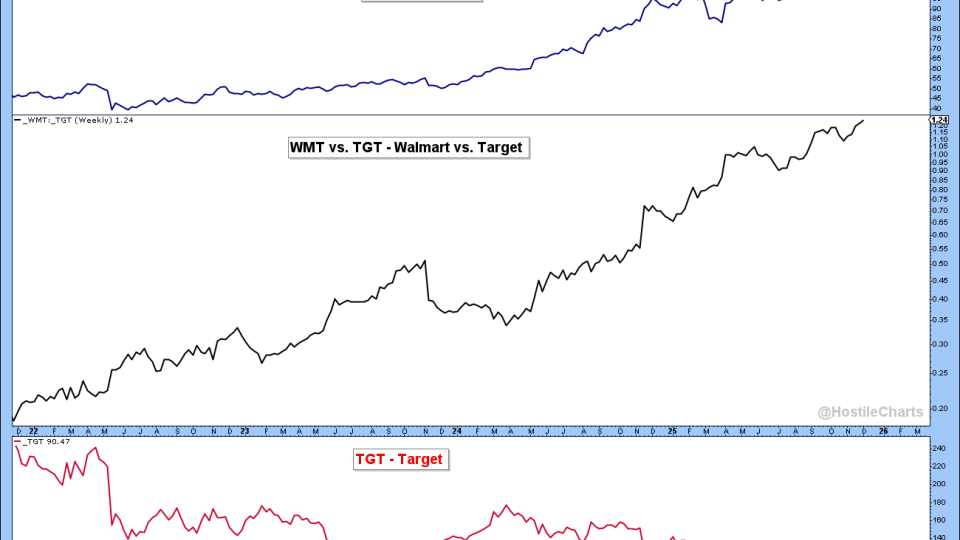
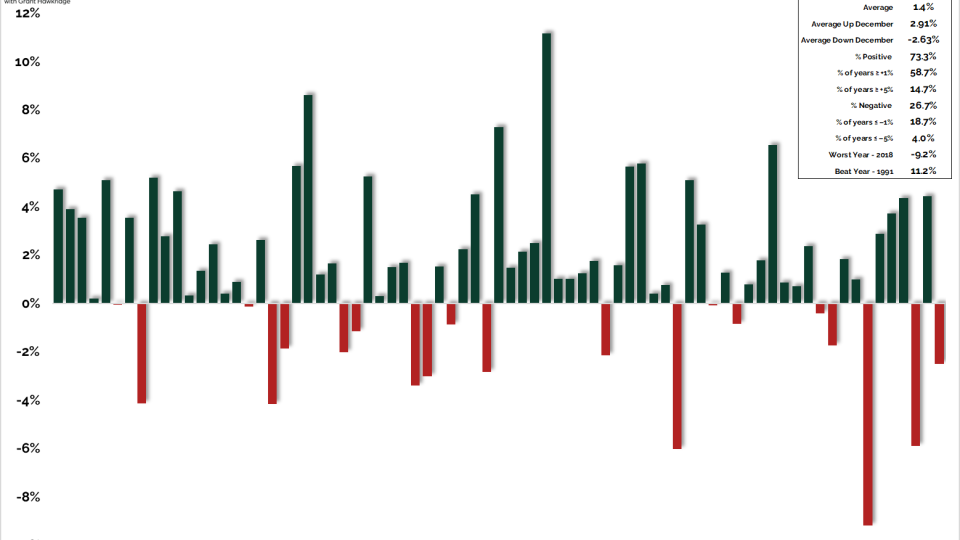
Most natural resource stocks, even the bellwethers of Metals or Energy, for example, can’t scale to $3 Trillion in market cap. They’re simply not built like the juggernauts of tech or communications.
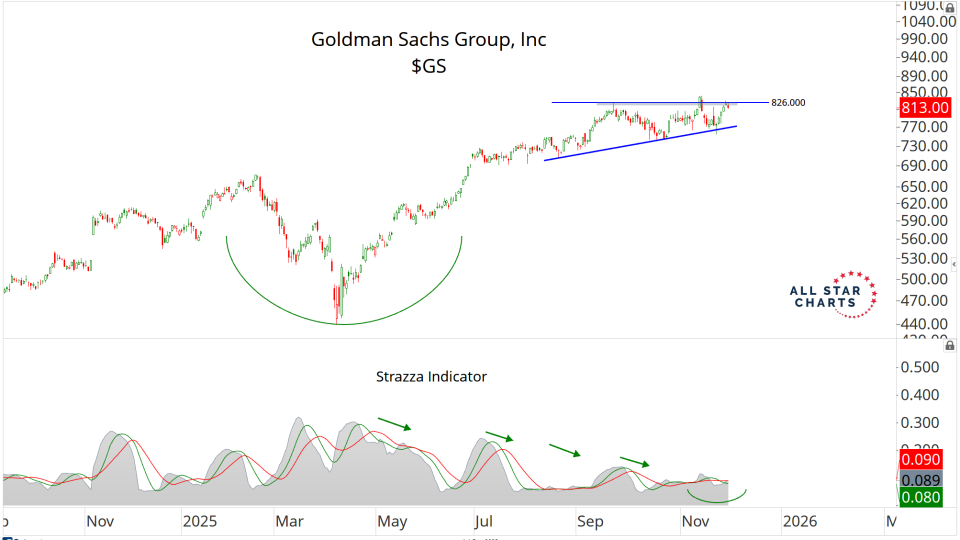
A seven-figure buy from the CEO adds fuel while the stock builds a major base for what’s to come
Every day, we sift through the filings to spot where the real conviction lies – cutting through the noise to highlight the most meaningful insider moves.
📌 Alumis $ALMS — CEO Srinivas Akkaraju bought $1.31 Million,...
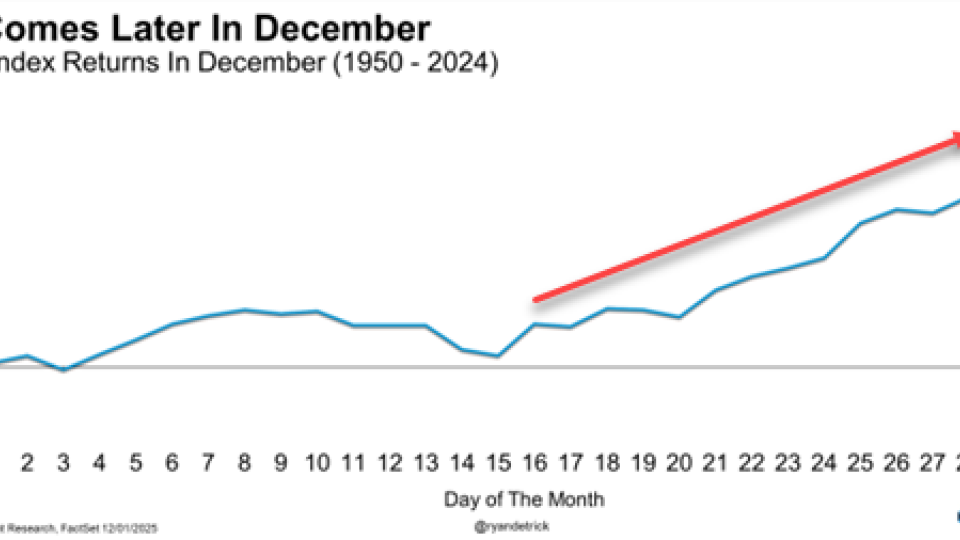
On Friday's holiday-shortened trading session, you'd be forgiven for not sitting in front of your screens during market hours. Half-days are common days for traders to step away. There's usually muted volume and little news flow to make anything worth...
Today's trade is in a stock on the verge of making fresh all-time highs while the options volatility masters are asleep at the switch, pricing cheap call options.